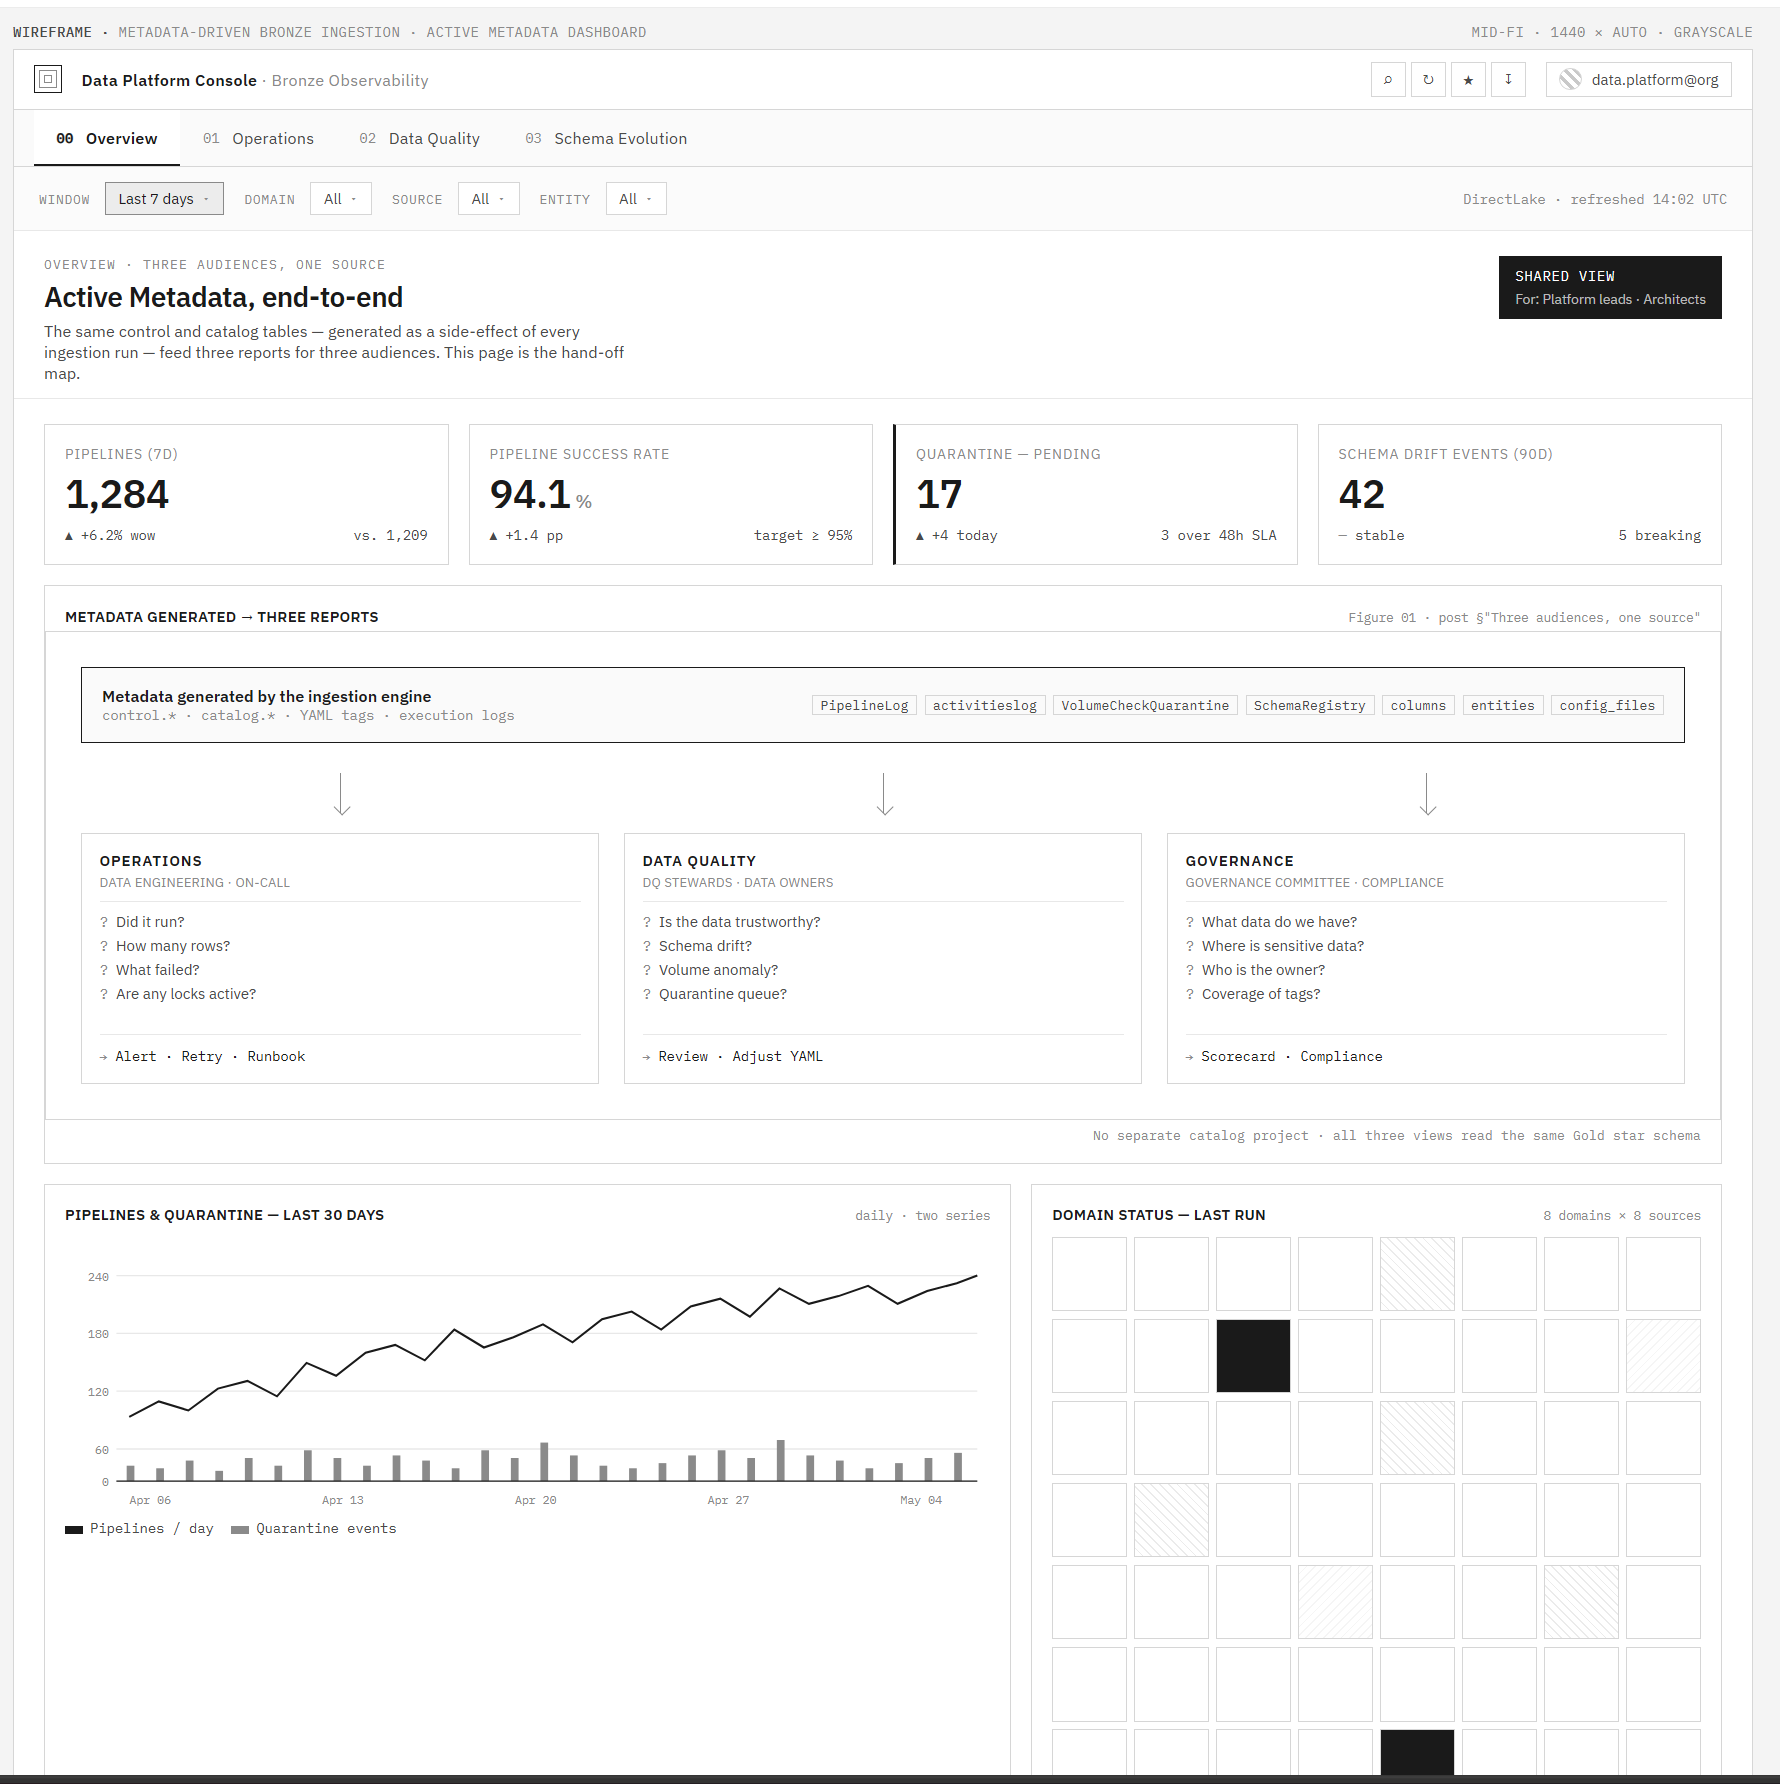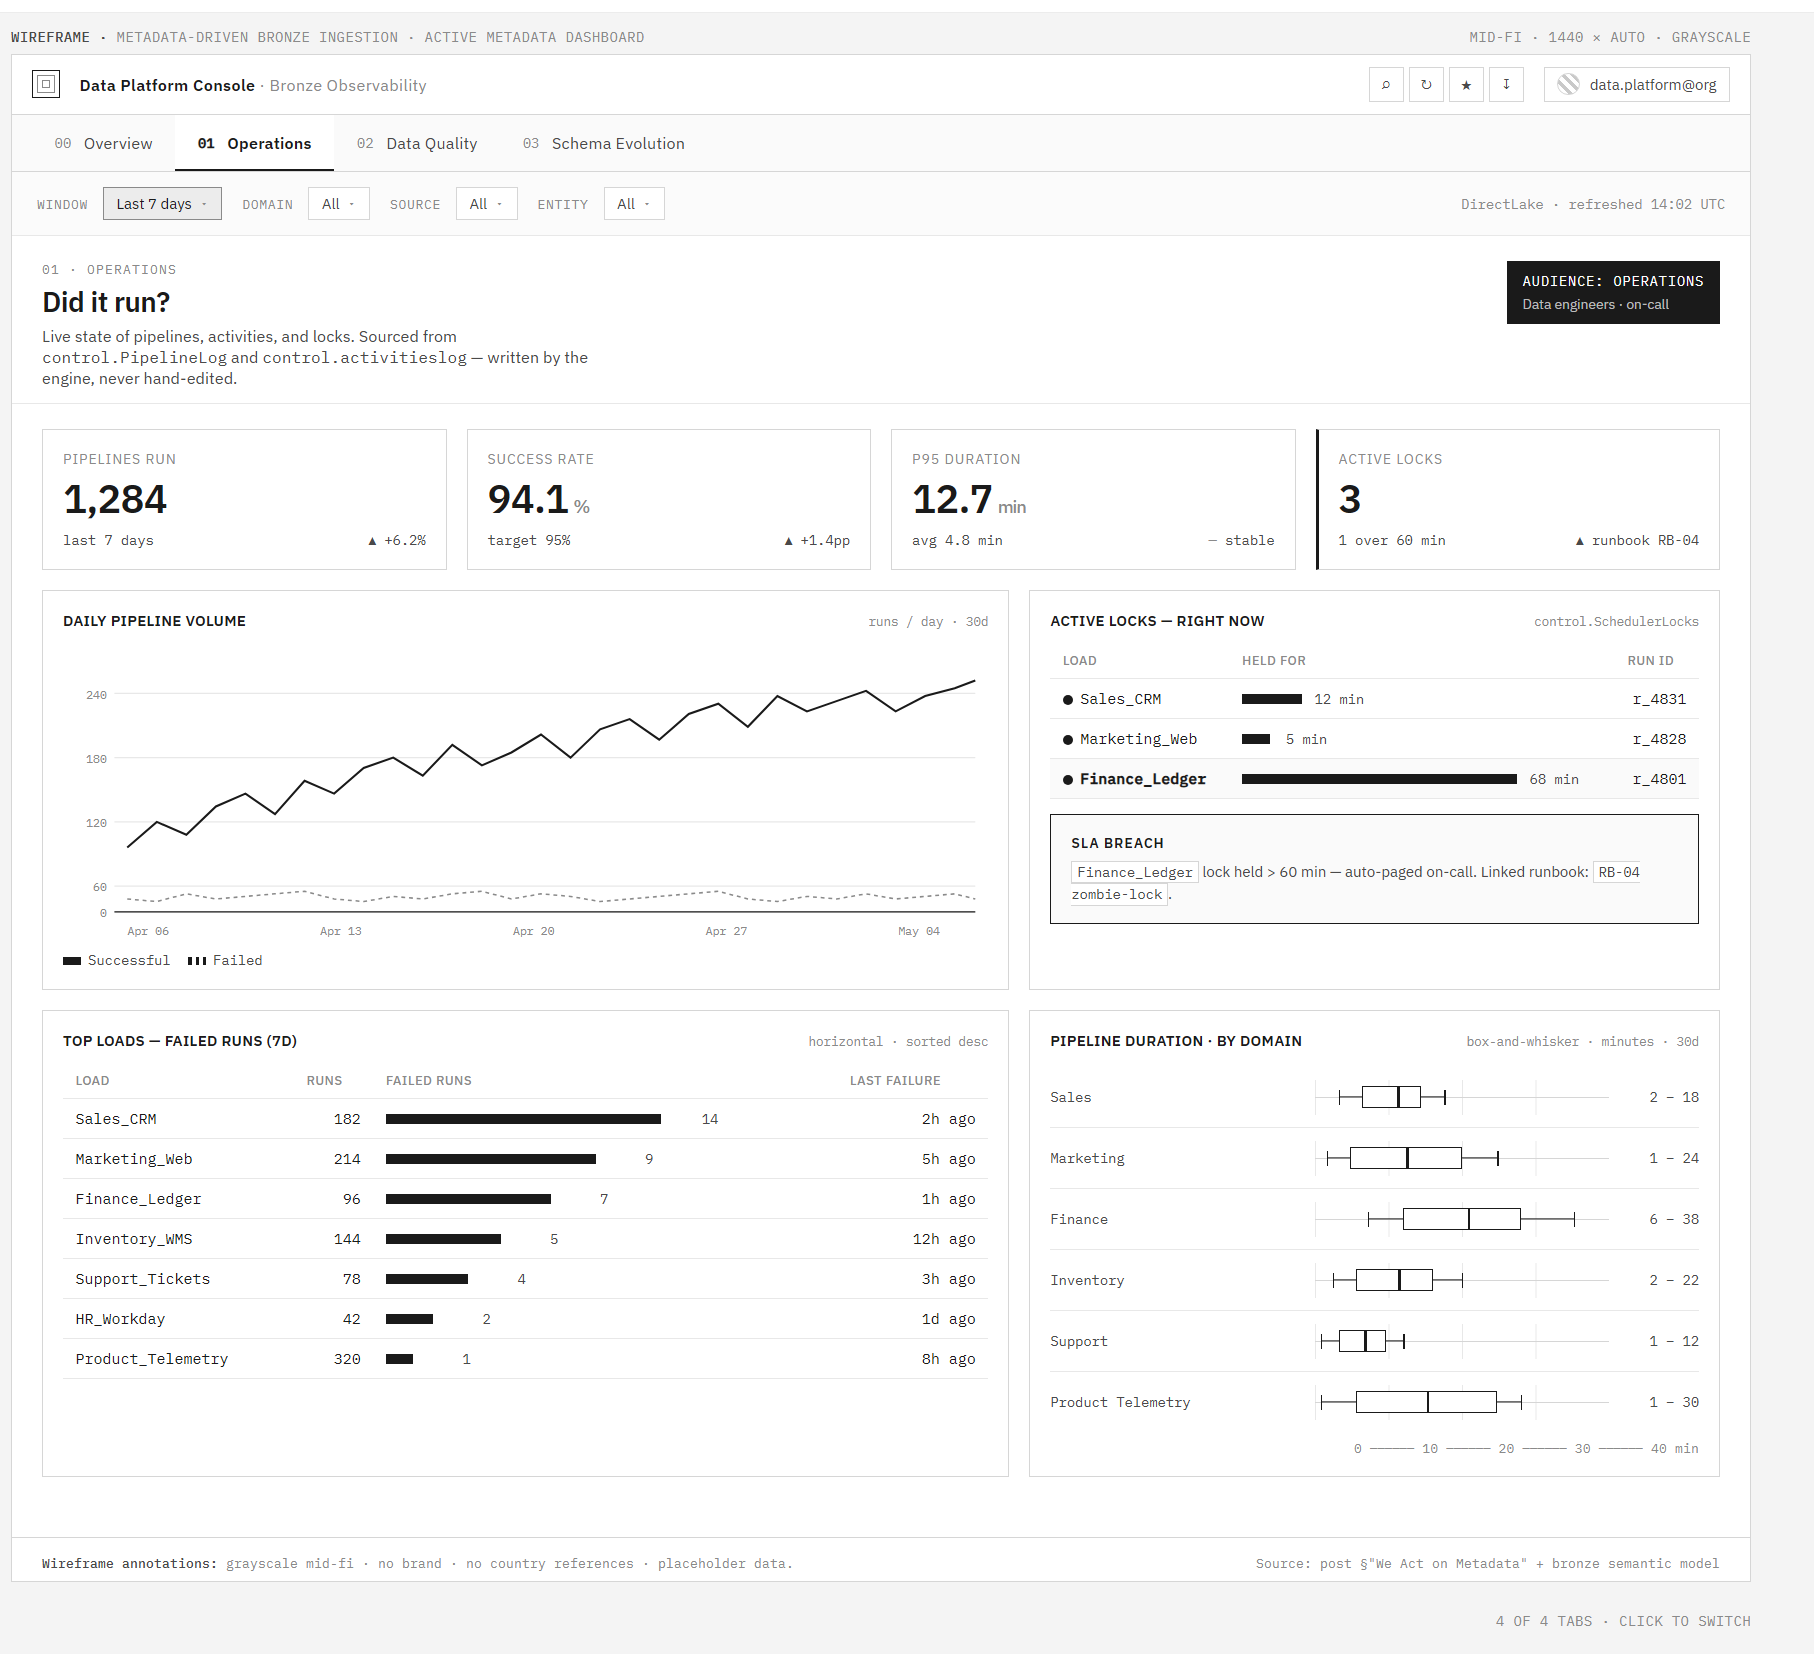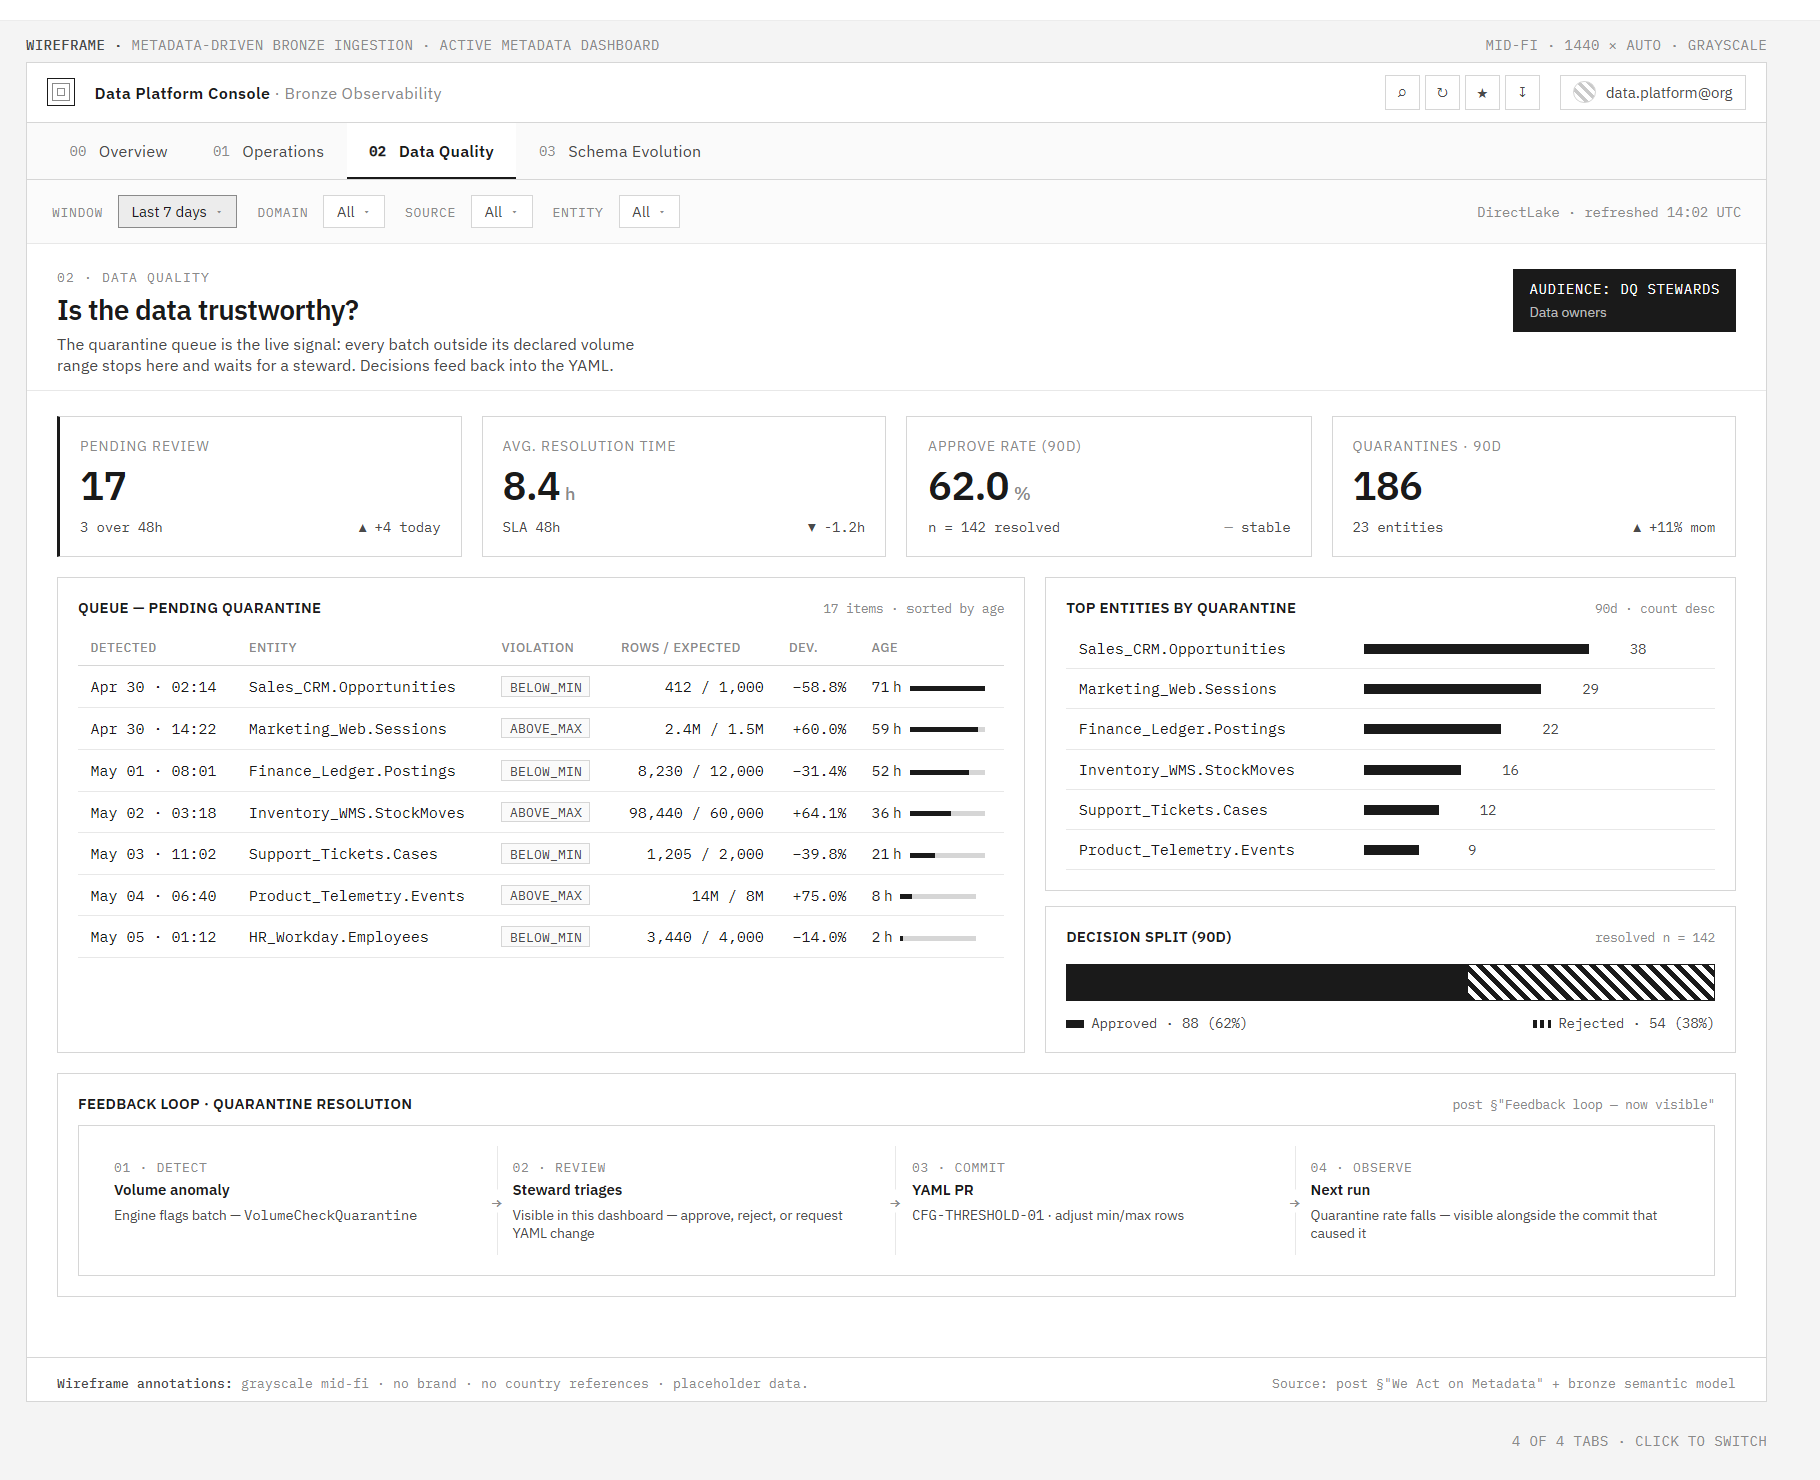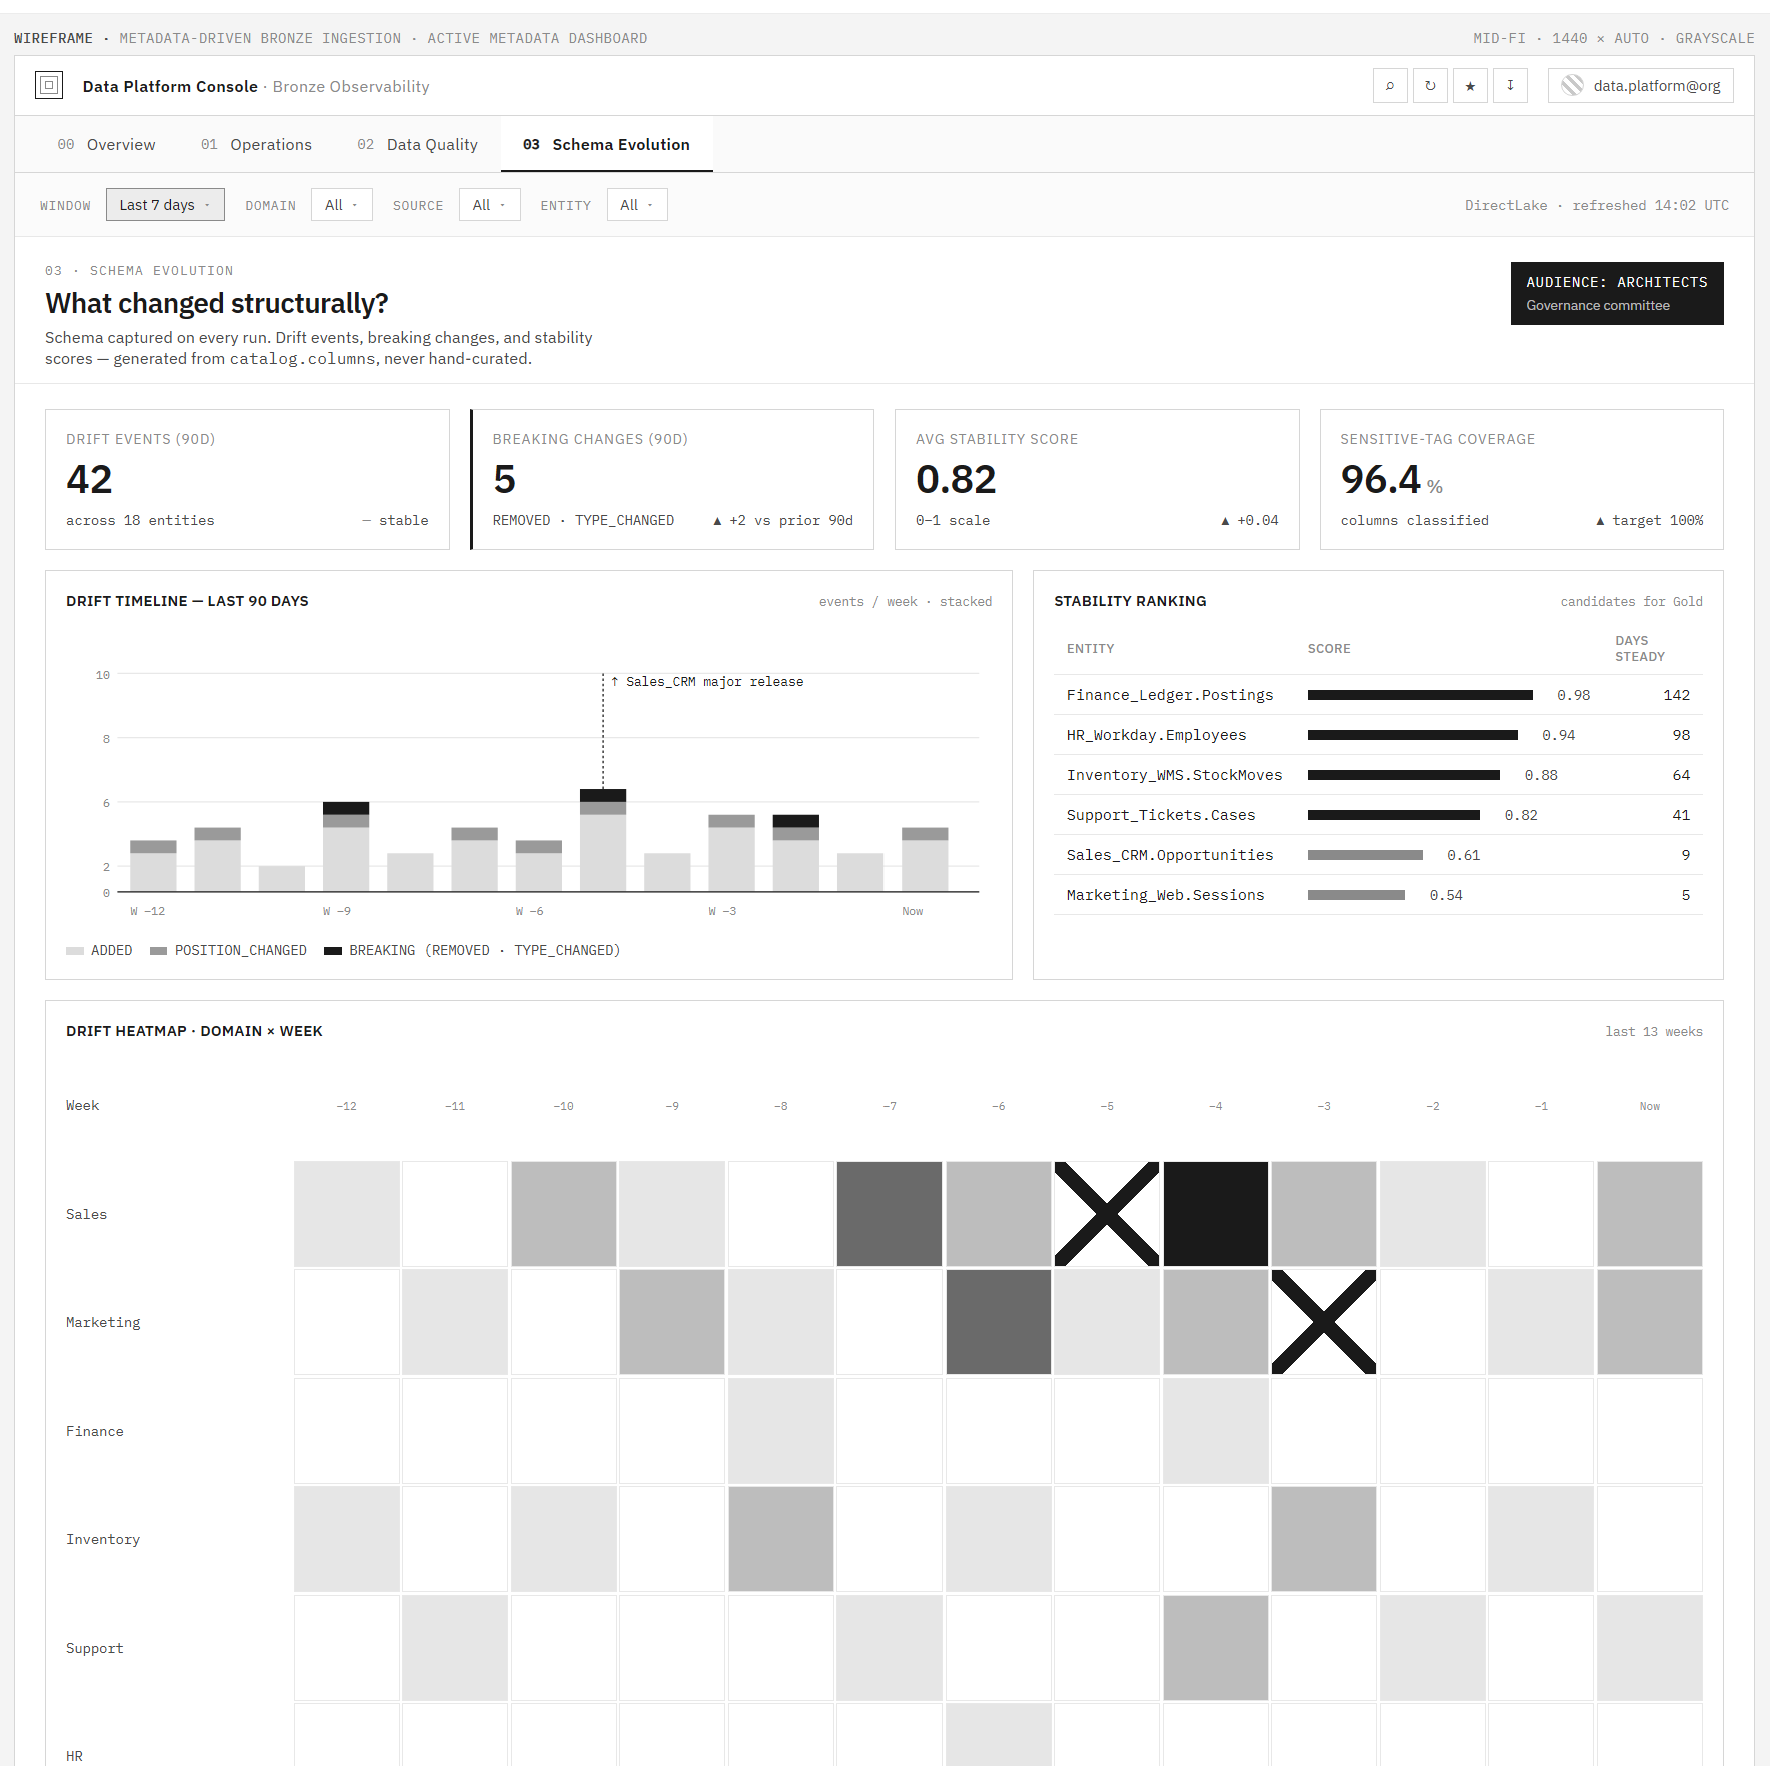
<?xml version="1.0" encoding="utf-8"?><feed xmlns="http://www.w3.org/2005/Atom" xml:lang="en"><generator uri="https://jekyllrb.com/" version="4.4.1">Jekyll</generator><link href="https://javierloria.com/feed.xml" rel="self" type="application/atom+xml"/><link href="https://javierloria.com/" rel="alternate" type="text/html" hreflang="en"/><updated>2026-07-08T01:31:46+00:00</updated><id>https://javierloria.com/feed.xml</id><title type="html">Javier Loria</title><subtitle>Javier Loria — data architect specializing in semantic models on the Microsoft data platform. Practical, in-depth writing, speaking, and upcoming books. </subtitle><entry><title type="html">We Act on Metadata</title><link href="https://javierloria.com/blog/2026/we-act-on-metadata/" rel="alternate" type="text/html" title="We Act on Metadata"/><published>2026-05-04T09:00:00+00:00</published><updated>2026-05-04T09:00:00+00:00</updated><id>https://javierloria.com/blog/2026/we-act-on-metadata</id><content type="html" xml:base="https://javierloria.com/blog/2026/we-act-on-metadata/"><![CDATA[<p><img src="/assets/img/feat-we-act-on-metadata.png" alt="We Act on Metadata"/></p> <p>Open a tap and water comes out. Six posts in, that’s still the right frame. If you’re just arriving, start at <a href="https://substack.com/@pragmaticdataarchitect/p-195740793">Post 1</a> – this is the end of the series. If you’ve made it this far: here’s what the infrastructure was quietly generating the whole time.</p> <hr/> <h2 id="we-kill-people-based-on-metadata">“We kill people based on metadata”</h2> <p>In April 2014, former NSA and CIA director Michael Hayden spoke at a Johns Hopkins symposium in the middle of the post-Snowden congressional debate. The NSA had been collecting metadata from telecom companies – call records, not call content. Who called whom, when, for how long, from what location, from what device. No conversations recorded. No content intercepted.</p> <p>“We kill people based on metadata,” Hayden said.</p> <p>The quote is jarring; that’s the point. Hayden wasn’t defending targeting policy – he was acknowledging what the system had become. Metadata was no longer the byproduct of intelligence work; it was the product. His own point: <em>“metadata absolutely tells you everything about somebody’s life.”</em> A pattern of calls – who you reach at what hour, from which location, how long those calls last – is sufficient to make targeting decisions without listening to a single word.</p> <p>Now consider the average enterprise data team.</p> <p>They have metadata. PII classifications in a catalog. Schema documentation. Data owner fields in a spreadsheet. Execution logs in a database nobody queries. They captured it – often at significant cost, a sprint or more. But the metadata exists and produces nothing. No decision depends on it. No process reads it automatically. It’s a compliance tax paid at launch, with no return on the investment after that.</p> <p>The NSA didn’t just collect metadata. They <em>acted on it</em> – continuously, systematically, as the primary output of a system designed for that purpose. The point isn’t the surveillance – it’s the decision-readiness. Hayden’s system connects metadata to targeting decisions by design. Most enterprise catalogs don’t connect metadata to any decision at all. The question isn’t whether to capture metadata. It’s whether your system acts on it – or leaves it as evidence of governance without the substance of it.</p> <p>In a system designed the way we’ve described, acting on metadata is not a second project. It’s the natural output of a platform that was always generating it. The runbooks, post-ingestion notebooks, and YAML feedback loops in Posts 4-5 already act on it where the loops are wired. The reports come next.</p> <p>This post connects the wires that are still loose.</p> <hr/> <h2 id="dead-metadata-is-the-norm">Dead metadata is the norm</h2> <p>The pattern every practitioner has lived.</p> <p>A team spends a sprint in the data catalog. Adding descriptions, assigning owners, validating PII classifications, drawing lineage. On launch day the catalog is 95% accurate and beautifully organized.</p> <p>Week three: a new source was onboarded. The catalog entry was queued but not created yet – this week’s sprint was all incidents. The schema for <code class="language-plaintext highlighter-rouge">Sales_Salesforce.Opportunities</code> had a column removed upstream. The catalog still lists it. The assigned data owner moved to a different business unit. Nobody updated the field.</p> <p>Month six: the governance team runs an audit. Sixty percent of catalog entries haven’t been touched since launch. Nobody can say which ones are accurate and which ones are stale. The catalog is now a liability – it gives the appearance of governance without the substance of it.</p> <p>Three forms of dead metadata, one failure mode:</p> <table> <thead> <tr> <th>Form</th> <th>When it was accurate</th> <th>When it stops being true</th> </tr> </thead> <tbody> <tr> <td>Data dictionary in Confluence</td> <td>Launch day</td> <td>Next sprint</td> </tr> <tr> <td>Lineage diagram in a slide deck</td> <td>The day it was drawn</td> <td>First schema change</td> </tr> <tr> <td>Data owner in a spreadsheet</td> <td>When they assigned it</td> <td>When the org chart changed</td> </tr> </tbody> </table> <p>The failure is structural, not behavioral. Metadata became a document someone had to maintain, competing with everything else on the backlog. When it lost that competition – and it always does – it quietly stopped being true while still looking official.</p> <p>Gartner mapped this in their 2022 Market Guide for Active Metadata Management (G00756612, De Simoni &amp; Beyer): five maturity levels, from Level 0 (Unaware) to Level 5 (Augmented). Most enterprise data teams sit at Level 1 or Level 2 – scheduled updates, coordinated descriptors, technically accurate at launch.</p> <p>The catalog was accurate on launch day.</p> <p>Level 3 – what Gartner calls Preactive – is where metadata starts working for you: schema drift detection, critical asset resolution, trend analysis. The platform described in this series generates those capabilities as a side-effect of execution, not as a separate project. Level 4 adds ML over profiling and automated recommendations – out of scope here, but not out of reach once you have the foundation.</p> <p>Active versus passive, in the Gartner maturity sense, isn’t a tool choice. It’s a design consequence. A Level 2 catalog was built to be maintained by humans; it loses to the backlog every time. A Level 3 system generates metadata continuously from execution; nobody has to remember to update it.</p> <hr/> <h2 id="this-system-already-generates-live-metadata">This system already generates live metadata</h2> <p>Here’s the twist. If you built what Posts 1-5 described, your platform has been generating metadata with every single run. You haven’t built a catalog – you’ve been generating one.</p> <p>DMBOK v2 describes operational metadata (Ch.12, §1.3.2.3) as “details of the processing and accessing of data” – logs of job execution, history of extracts, audit results. Every table in this platform matches that definition exactly:</p> <table> <thead> <tr> <th>Table</th> <th>What it captures</th> <th>Frequency</th> </tr> </thead> <tbody> <tr> <td><code class="language-plaintext highlighter-rouge">control.PipelineLog</code></td> <td>Run status, domain, start/end, error, tags</td> <td>Every pipeline execution</td> </tr> <tr> <td><code class="language-plaintext highlighter-rouge">control.ActivityLog</code></td> <td>Per-entity activity, YAML path, YAML version, row counts</td> <td>Every entity load</td> </tr> <tr> <td><code class="language-plaintext highlighter-rouge">control.VolumeCheckQuarantine</code></td> <td>Volume anomalies, thresholds, resolution status</td> <td>Every volume check</td> </tr> <tr> <td><code class="language-plaintext highlighter-rouge">control.SchedulerLocks</code></td> <td>Lock state, acquire/release timestamps, reasons</td> <td>Every scheduler cycle</td> </tr> <tr> <td><code class="language-plaintext highlighter-rouge">catalog.Columns</code></td> <td>Schema per entity, PII classification, capture timestamp</td> <td>Every schema capture run</td> </tr> <tr> <td><code class="language-plaintext highlighter-rouge">catalog.Entities</code></td> <td>Entity registry: domain, source, country, config file</td> <td>Every deployment</td> </tr> <tr> <td><code class="language-plaintext highlighter-rouge">catalog.ConfigFiles</code></td> <td>Config audit: git commit hash, deployed_at</td> <td>Every YAML deploy</td> </tr> </tbody> </table> <p>The key distinction from Post 2: these are <em>operational</em> metadata – generated by execution, per DMBOK’s definition above. One design rule the platform adds on top: these tables are never hand-edited. Post 2 handled <em>configuration</em> metadata: born from the contract, lives in Git. Different origin, same principle. The YAML is configuration; everything these tables capture is operational.</p> <p>In most Lakehouses, catalog and ingestion are separate teams, separate tools, separate cadences. In this platform, <code class="language-plaintext highlighter-rouge">catalog.Columns</code> is updated with every ingestion run. The catalog is not a project. It’s a side-effect.</p> <hr/> <h2 id="from-logs-to-decisions-the-gold-layer">From logs to decisions: the Gold layer</h2> <p>Operations engineers query the control tables directly – the runbooks in Post 5 carry those queries for exactly that purpose. For everyone else – DQ stewards, governance committees, business stakeholders – raw execution logs are the wrong starting point. Decisions need a semantic model.</p> <p>The translation layer is a star schema in the Gold warehouse that converts logs into metrics, metrics into KPIs, KPIs into decisions. A note on the term: when Medallion talks about “Gold,” it usually means business aggregations – Sales, Finance, ARR. Here, Gold is the operational counterpart: same Medallion discipline, different domain. Two Gold layers sit side by side in the Warehouse: one for the business, one for the platform that runs it.</p> <p>The schema has three dimensions (Countries, Dates, Entities) and two facts: Findings for quality anomalies and quarantine events, and QualityMetrics for completeness, uniqueness, and validity scores. One hard constraint: zero PII in Gold. The Gold layer contains only aggregated metrics – never the underlying row data. <code class="language-plaintext highlighter-rouge">catalog.Columns</code> may reference which columns are PII-tagged, but the values themselves never leave Bronze.</p> <p>The transformation chain:</p> <div class="language-plaintext highlighter-rouge"><div class="highlight"><pre class="highlight"><code>Raw log → Metric → KPI → Decision

PipelineLog rows      →  % success rate        →  SLA compliance    →  Escalate / Accept
VolumeCheckQuarantine →  Anomalies this week    →  Quality score     →  Adjust thresholds
catalog.Columns      →  Drift events by entity →  Schema stability  →  Prioritize review
catalog.Entities     →  Coverage by domain     →  Governance score  →  Report to committee
</code></pre></div></div> <p>The architecture is deliberately boring. Stored Procedures in the Fabric Warehouse read from the Lakehouse tables and load incrementally into the star schema. Direct Lake means the semantic model never needs a scheduled refresh – Power BI reads the Warehouse’s underlying Delta tables directly from OneLake, without round-trips through SQL. In Fabric, the Warehouse sees the Lakehouse as a database – a three-part name <code class="language-plaintext highlighter-rouge">[Lakehouse].[Schema].[Table]</code> is all it takes to query across the boundary:</p> <div class="language-sql highlighter-rouge"><div class="highlight"><pre class="highlight"><code><span class="c1">-- Incremental load from the metadata Lakehouse into the Gold star schema</span>
<span class="k">SELECT</span> <span class="n">RunID</span><span class="p">,</span> <span class="k">Domain</span><span class="p">,</span> <span class="n">StartTime</span><span class="p">,</span> <span class="n">EndTime</span><span class="p">,</span> <span class="n">Status</span><span class="p">,</span> <span class="n">RowCount</span>
<span class="k">FROM</span>   <span class="n">Lh_Metadata</span><span class="p">.</span><span class="n">control</span><span class="p">.</span><span class="n">PipelineLog</span>
<span class="k">WHERE</span>  <span class="n">LoadDateUTC</span> <span class="o">&gt;</span> <span class="o">@</span><span class="n">last_loaded</span>
</code></pre></div></div> <p>That’s the pattern for every fact table. No Kafka. No EventHub. No dedicated observability platform. A Stored Procedure and a delta parameter. And every row carries its own lineage – RunID, BatchID, SnapshotDate – without a separate lineage tool.</p> <p>A concrete example end-to-end: <code class="language-plaintext highlighter-rouge">Sales_Salesforce.Opportunities</code> gains a new column <code class="language-plaintext highlighter-rouge">CloseDate_Adjusted</code> in the source. A post-ingestion notebook, an optional but recommended task that fires after each pipeline run, queries the ingested table, compares its current schema against the last recorded state in <code class="language-plaintext highlighter-rouge">catalog.Columns</code>, and writes any new or removed columns as drift events. Schema capture is declared alongside the other post-ingestion tasks in the entity’s YAML:</p> <div class="language-yaml highlighter-rouge"><div class="highlight"><pre class="highlight"><code><span class="na">post_ingestion_tasks</span><span class="pi">:</span>
  <span class="na">volume_check</span><span class="pi">:</span>
    <span class="na">enabled</span><span class="pi">:</span> <span class="kc">true</span>
    <span class="na">min_rows</span><span class="pi">:</span> <span class="m">1000</span>
    <span class="na">max_rows</span><span class="pi">:</span> <span class="m">5000000</span>
  <span class="na">schema_capture</span><span class="pi">:</span>
    <span class="na">enabled</span><span class="pi">:</span> <span class="kc">true</span>
</code></pre></div></div> <p>It detects <code class="language-plaintext highlighter-rouge">CloseDate_Adjusted</code> and records it. Gold surfaces: “3 schema drift events this week in the Sales domain.” The DQ steward opens a review: is this intentional? Does the column need a PII tag? YAML is updated via PR. Next run: <code class="language-plaintext highlighter-rouge">catalog.Columns</code> reflects the classification; governance dashboard shows 100% coverage restored.</p> <p>One event. One review. Zero manual catalog updates.</p> <hr/> <h2 id="three-audiences-one-source">Three audiences, one source</h2> <p>The same tables serve three audiences asking very different questions. Most platforms build one of these – the ops dashboard – and call it done. All three matter, and all three are addressable from the same source.</p> <p><img src="/assets/img/yaml-overview.png" alt="Mockup of the Active Metadata Dashboard Overview tab, showing KPI cards for pipeline success rate, active locks, drift events, and PII coverage"/> <em>Mockup – Data Platform Console, Bronze Observability (in development). The Overview tab surfaces KPIs and routes to three audience-specific views: Operations, Data Quality, and Schema Evolution.</em></p> <p><strong>Operations</strong> – primary sources: <code class="language-plaintext highlighter-rouge">control.PipelineLog</code>, <code class="language-plaintext highlighter-rouge">control.ActivityLog</code>, <code class="language-plaintext highlighter-rouge">control.SchedulerLocks</code>. The questions: did it run? How many rows? What failed? Locks active? The decision layer: Teams alerts, runbook triggers, retry decisions. The ops team doesn’t need to open a YAML file to know whether last night’s loads completed.</p> <p><img src="/assets/img/yaml-operations.png" alt="Mockup of the Operations Dashboard answering &quot;Did it run?&quot;, showing pipeline volume, active locks, SLA breaches, and top failed runs"/> <em>Mockup – Operations view (in development): pipeline volume, active locks, SLA breach detection, and top failed runs, once built, sourced from <code class="language-plaintext highlighter-rouge">control.PipelineLog</code> and <code class="language-plaintext highlighter-rouge">control.ActivityLog</code>.</em></p> <p><strong>Data Quality</strong> – primary sources: <code class="language-plaintext highlighter-rouge">control.VolumeCheckQuarantine</code>, <code class="language-plaintext highlighter-rouge">catalog.Columns</code>. The questions: is the data trustworthy? Is there schema drift? Is the quarantine backlog growing? Schema drift detected in <code class="language-plaintext highlighter-rouge">catalog.Columns</code> is the early signal, before anyone reports “the numbers look off.”</p> <p><img src="/assets/img/yaml-dataquality.png" alt="Mockup of the Data Quality Dashboard answering &quot;Is the data trustworthy?&quot;, showing the quarantine queue, volume ranges, and resolution workflow"/> <em>Mockup – Data Quality view (in development): quarantine queue with volume vs. expected ranges, resolution workflow, and the feedback loop made visible, from volume anomaly to YAML threshold adjustment.</em></p> <p><strong>Governance</strong> – primary sources: <code class="language-plaintext highlighter-rouge">catalog.Entities</code>, <code class="language-plaintext highlighter-rouge">catalog.Columns</code> (pii_classification), <code class="language-plaintext highlighter-rouge">catalog.ConfigFiles</code>, plus the Git history of the YAML files themselves – a complete audit trail of every configuration decision, surfaced through <code class="language-plaintext highlighter-rouge">catalog.YamlChanges</code> once its ETL is wired (see below). The questions: what data do we have? Where is PII? Who owns it? Are all columns classified? The governance committee doesn’t open Power BI – but the governance analyst who briefs them does. The dashboard replaces a manually assembled quarterly report with a live view over data the system generates continuously.</p> <p>The YAML tags from Post 2 – <code class="language-plaintext highlighter-rouge">security.sensitivity</code>, <code class="language-plaintext highlighter-rouge">governance.data_owner</code> – are live here. Updated via Git PR, not a manual catalog UI. The change management lens is already complete: every YAML file carries its full Git history – a tamper-evident record of every configuration decision ever made, who proposed it, who approved it, when it landed, what changed. Post 1’s GitOps discipline has been generating this trail since day one. What’s pending is the wiring: one ETL script (<code class="language-plaintext highlighter-rouge">git log --follow config/*.yml</code>) materializes it as <code class="language-plaintext highlighter-rouge">catalog.YamlChanges</code>, queryable alongside the operational data. Until then, the same questions are answerable – they just require <code class="language-plaintext highlighter-rouge">git log</code> and a steward’s time instead of a SQL join. The questions either path resolves:</p> <ul> <li><em>“Who changed the PII classification for Opportunities, and when?”</em> – independently of whether the load ran that day</li> <li><em>“Were there any YAML changes in the week before this quarantine spike?”</em> – correlating config decisions with operational outcomes (one query after the ETL lands; a <code class="language-plaintext highlighter-rouge">git log</code> plus manual cross-reference until then)</li> <li><em>“Which YAMLs haven’t been touched in 12 months?”</em> – stale config detection: a source with no recent commits and declining row counts deserves a review</li> <li><em>“How many new sources were onboarded this quarter?”</em> – growth velocity and team workload, counted from <code class="language-plaintext highlighter-rouge">change_type = 'created'</code></li> </ul> <p>The Git audit trail is already a governance asset. The ETL just makes it a queryable one.</p> <p><img src="/assets/img/yaml-schema-evolution.png" alt="Mockup of the Schema Evolution Dashboard answering &quot;What changed structurally?&quot;, showing drift events, breaking changes, stability scores, and a heatmap"/> <em>Mockup – Schema Evolution view (in development): drift events over 90 days, breaking changes, stability scores by entity, sensitive-tag coverage, and a domain × week heatmap, once built, sourced from <code class="language-plaintext highlighter-rouge">catalog.Columns</code>, never hand-curated.</em></p> <p>The data is generated automatically. No one has to remember to update <code class="language-plaintext highlighter-rouge">catalog.Columns</code> when a schema changes – the next ingestion run does it. No one updates <code class="language-plaintext highlighter-rouge">control.VolumeCheckQuarantine</code> manually – it populates when a threshold is breached. Once built, the dashboards above will be views over live state, not over a maintained document.</p> <hr/> <h2 id="the-feedback-loop--now-visible">The feedback loop – now visible</h2> <p>These feedback patterns existed before Post 6. Schema drift triggered YAML updates in Post 4. Volume anomalies drove threshold adjustments. New columns prompted PII tags. The loop was always there. What Post 6 adds is visibility – the loop is now queryable from the same dashboard as the operational data it responds to. Before: you could trace it via <code class="language-plaintext highlighter-rouge">git blame</code> if you knew what to look for. Now: you can see it in Power BI alongside the events that triggered it.</p> <p>The loop patterns – now queryable:</p> <ul> <li><strong>Schema drift →</strong> <code class="language-plaintext highlighter-rouge">catalog.Columns</code> captures the new column → DQ steward reviews → YAML updated via <code class="language-plaintext highlighter-rouge">CFG-SCHEMA-01</code></li> <li><strong>Volume anomaly →</strong> entity goes to quarantine → YAML <code class="language-plaintext highlighter-rouge">min_rows</code>/<code class="language-plaintext highlighter-rouge">max_rows</code> adjusted via <code class="language-plaintext highlighter-rouge">CFG-THRESHOLD-01</code></li> <li><strong>PII in new column →</strong> <code class="language-plaintext highlighter-rouge">catalog.Columns</code> flags it → <code class="language-plaintext highlighter-rouge">security.classification: "PII"</code> added via PR</li> <li><strong>Config change correlation →</strong> Git already records the threshold adjustment; <code class="language-plaintext highlighter-rouge">catalog.YamlChanges</code> (once wired) lets you join it with the quarantine rate that followed in a single SQL query</li> </ul> <p>In most Lakehouses, the feedback loop is a meeting. In this system, it’s a commit – observable, diff-able, traceable to the event that triggered it.</p> <hr/> <h2 id="honest-tradeoffs">Honest tradeoffs</h2> <p>This system gives you a great deal. It’s worth being explicit about what it doesn’t give you.</p> <p><strong>Business metadata.</strong> What <code class="language-plaintext highlighter-rouge">Sales_Opportunities.CloseDate</code> <em>means</em> to a business analyst – its business definition, its calculation rules, how it relates to ARR – still requires human input. No amount of schema capture fills that gap. You have technical metadata and operational metadata. Business metadata remains a documentation project.</p> <p><strong>Enterprise lineage.</strong> You have Bronze lineage: every row traces to its source system, run, and batch. You don’t have what happens to the data after it leaves your Lakehouse. If <code class="language-plaintext highlighter-rouge">Opportunities</code> feeds a downstream ERP or a finance report, that lineage lives outside your control tables.</p> <p><strong>Fully wired alerts.</strong> <code class="language-plaintext highlighter-rouge">RunbookRef</code> as a first-class dimension in ops analytics – mentioned in Post 5 – is aspirational. The wiring between alert payload and runbook ID isn’t automatic yet. The analytics are there; the plumbing to make alerts self-identifying still requires tooling work.</p> <p><strong>Two pieces not yet wired.</strong> The Warehouse, Stored Procedures, and semantic model are built and live. The dashboards are designed and being built – “the data is ready” is true, “the dashboards are live” is not yet. <code class="language-plaintext highlighter-rouge">catalog.YamlChanges</code> is the second piece: the Git audit trail is complete, only the ETL that materializes it as a queryable table is pending. Until both land: dashboards live in mockups, and config-vs-outcome correlations require <code class="language-plaintext highlighter-rouge">git log</code> plus a steward’s manual cross-reference.</p> <p><strong>Config drift is still a manual discipline.</strong> <code class="language-plaintext highlighter-rouge">catalog.ConfigFiles</code> helps detect it – you can compare the deployed commit hash against Git’s current HEAD. But there is no automated CD. Every deploy requires a human to copy the YAML to the Lakehouse and run a smoke test. <code class="language-plaintext highlighter-rouge">CFG-SYNC-01</code> documents the procedure; the procedure still depends on the engineer remembering to follow it. Detection improved; prevention didn’t.</p> <p>What you do get: observability without a separate observability stack. Governance coverage without a separate catalog project. Quality monitoring without a separate DQ tool. These emerged as side-effects of designing the ingestion layer well from day one. You didn’t add them – you uncovered them.</p> <hr/> <h2 id="the-tap-revisited">The tap, revisited</h2> <p>Here’s the complete system, stated plainly.</p> <p>A fixed engine of specialized components handles relational and file sources – the same patterns extend to REST APIs – without new code per source. N YAML files declare what to ingest, how to classify it, who owns it, what governance applies. Yamale validates the shape of every YAML before it deploys. The filename encodes domain ownership as a political contract, not just a naming convention. Every change to every YAML goes through Git – reviewed, diff-able, reversible.</p> <p>The scheduler declares data freshness as a contract. Distributed locks prevent double-execution. Retry policy lives in one place. Every schedule decision is a Git commit.</p> <p>Battle scars are encoded where they belong – in the YAML, not in tribal knowledge. The engine handles legacy date formats, partial failures, zombie locks, and config sync gaps without human intervention. Where it can’t, a runbook holds the procedure. Versioned. Scoped. 3am-ready.</p> <p>And all of it – every execution, every schema change, every volume anomaly, every lock acquired and released – was generating metadata the whole time. Six posts to build the engine. This post to wire up what the engine was always producing.</p> <hr/> <p>Post 1 opened with a tap. Bronze should be boring. Infrastructure is invisible. You turn on the tap and water comes out – you don’t think about the pipes.</p> <p>Post 6 closes with what happens when the tap works: you stop thinking about the tap and start thinking about what you do with the water.</p> <p>The metadata-driven platform doesn’t just ingest data more reliably. It generates the raw material for operations, quality, and governance decisions as a natural side-effect of being well-designed. You didn’t build a catalog. You didn’t stand up an observability platform. You didn’t commission a governance reporting project. You built an ingestion layer that couldn’t help but document itself, monitor itself, and generate the raw material for the reports that will drive decisions about itself. The runbooks, notebooks, and Git PRs were always acting on it. The dashboards are the last mile.</p> <p><em>Bronze was boring. That was always the plan. What wasn’t obvious on day one: boring infrastructure generates interesting metadata. The dashboards finish what the engine started.</em></p> <hr/> <p><em>This is the sixth and final post in the series “YAML Metadata-Driven Ingestion.” The patterns described here have evolved across several enterprise Lakehouse implementations and are platform-agnostic, though our reference stack is Microsoft Fabric.</em></p>]]></content><author><name></name></author><category term="yaml-ingestion"/><category term="governance"/><category term="data-quality"/><category term="observability"/><category term="metadata"/><category term="microsoft-fabric"/><summary type="html"><![CDATA[How a boring ingestion layer becomes the foundation for ops, quality, and governance -- without a separate catalog project]]></summary></entry><entry><title type="html">Runbooks as Infrastructure</title><link href="https://javierloria.com/blog/2026/runbooks-as-infrastructure/" rel="alternate" type="text/html" title="Runbooks as Infrastructure"/><published>2026-05-02T09:00:00+00:00</published><updated>2026-05-02T09:00:00+00:00</updated><id>https://javierloria.com/blog/2026/runbooks-as-infrastructure</id><content type="html" xml:base="https://javierloria.com/blog/2026/runbooks-as-infrastructure/"><![CDATA[<p><img src="/assets/img/feat-runbooks.webp" alt="Runbooks as Infrastructure"/></p> <p>Open a tap and water comes out. The first four posts in this series built the infrastructure behind that tap; this one is about what happens when the tap breaks at 3:00 am and a human has to answer the page. Posts 1 through 4 are linked when they come up. The thesis of this post: every scar leaves behind two artifacts – a YAML field or partition strategy for the engine, and a runbook for the human. Post 4 ended on the first. This post is about the second.</p> <p>The infrastructure is excellent. The YAML is versioned. The scars are documented. And at 3:14am, the scheduler pages. <code class="language-plaintext highlighter-rouge">control.SchedulerLocks</code> shows <code class="language-plaintext highlighter-rouge">Sales_Salesforce</code> locked, acquired four hours ago, no release timestamp. The engineer on call did not build this system, did not write the YAML, and will not remember anything about scheduler lock semantics at this hour. What they have is a mobile phone, a VPN connection, and a runbook ID printed next to the alert: <code class="language-plaintext highlighter-rouge">OPS-LOCK-01</code>.</p> <p>That ID is either infrastructure or theater. The difference is everything.</p> <p>The relationship between scars and runbooks is the architecture, not a side effect. Each scar is a lesson the engine didn’t anticipate. The YAML field encodes the fix so the engine handles it next time. The runbook encodes what the operator does in the window between “the engine hit a wall” and “the engine has been updated to handle this” – a window that can be minutes or years, depending on whether absorbing the pattern into the YAML is worth the engineering investment. Some runbooks stay forever, because the failure mode requires judgment no config can encode. Many retire into the YAML and the knowledge becomes contract – the organization’s accumulated operational knowledge, built in production by people who learned it the hard way.</p> <figure> <picture> <source class="responsive-img-srcset" srcset="/assets/img/yaml-runbook-lifecycle-480.webp 480w,/assets/img/yaml-runbook-lifecycle-800.webp 800w,/assets/img/yaml-runbook-lifecycle-1400.webp 1400w," type="image/webp" sizes="95vw"/> <img src="/assets/img/yaml-runbook-lifecycle.png" class="img-fluid rounded z-depth-1" width="100%" height="auto" data-zoomable="" loading="eager" onerror="this.onerror=null; document.querySelectorAll('.responsive-img-srcset').forEach(function (n) { n.remove(); });"/> </picture> </figure> <div class="caption">A runbook's lifecycle: a production failure generates a runbook; when the same pattern recurs often enough, the fix graduates into a YAML field the engine handles automatically.</div> <hr/> <h2 id="why-most-runbooks-are-already-dead">Why most runbooks are already dead</h2> <p>Most data engineering teams have <em>something</em> they call a runbook. A Confluence page. A SharePoint folder. A pinned Teams thread. A document in someone’s OneDrive labeled “Operations Notes (v3 final).” The form varies. The failure mode doesn’t.</p> <p>All of these drift from the running system. The YAML evolves. The control table gets renamed. A new partition strategy changes the retry logic. The runbook keeps describing the old version, silently, with no test that catches the divergence.</p> <p>Call it documentation theater. It produces the artifacts an audit expects to see. It fills a column in a compliance checklist. It looks like operational readiness. And the moment the actual incident happens, the runbook doesn’t match the system, and the engineer reverts to the only reliable strategy – guessing, and calling someone.</p> <p>Four symptoms of a rotted runbook:</p> <ol> <li><strong>Wrong names everywhere.</strong> Table names, column names, paths – the schema drifted and nobody updated the runbook.</li> <li><strong>Steps that are no longer steps.</strong> “Run the nightly script” – the nightly script was replaced by a pipeline six months ago.</li> <li><strong>Missing failure modes.</strong> The runbook was written before <code class="language-plaintext highlighter-rouge">parquet_date_fix</code> existed. There’s no entry for <code class="language-plaintext highlighter-rouge">INCONSISTENT_BEHAVIOR_CROSS_VERSION</code>. The engineer is on their own.</li> <li><strong>Silent on prevention.</strong> The runbook assumes you already know there’s a problem. It tells you what to do when an alert fires – but not what to check before the alert fires. Proactive monitoring – what dashboards to review at the start of a shift, what normal scheduler execution frequency looks like, what early signals precede a throttling event – never gets written, because it’s never the thing on fire today.</li> </ol> <p>The result: your runbooks are good at recovery and silent on prevention. The library only activates after something has already failed.</p> <hr/> <h2 id="the-3am-test">The 3am test</h2> <p>One test. Everything else follows from it.</p> <blockquote> <p><strong>Hand the runbook to an engineer who did not build the system. Wake them up at 3am. Give them the alert and the runbook ID. Can they execute the runbook without calling you?</strong></p> </blockquote> <p>If no: the runbook isn’t finished. Doesn’t matter how well-written it is, how many diagrams it has, how many reviewers approved it. If executing it requires context that isn’t on the page, the runbook is a memory aid, not a runbook.</p> <p>Four sub-tests that expose failure:</p> <ul> <li><strong>The runnable test:</strong> can the engineer execute the SQL cell in place against the attached lakehouse, or do they have to translate placeholders from memory before it works?</li> <li><strong>The “what next” test:</strong> after each action, is it clear what to verify before moving to the next step?</li> <li><strong>The escalation test:</strong> if action #3 doesn’t resolve it, is there a named person to contact, and does the runbook have their contact information?</li> <li><strong>The wrong-runbook test:</strong> can the engineer tell within 30 seconds whether this is even the right runbook for their situation? Or does that require reading three sections first?</li> </ul> <p>The fourth sub-test is where most runbooks fail silently. The alert fires. The engineer finds a runbook that looks relevant. They execute step 1. Then step 2. In step 3 they realize the situation they have is subtly different from the one the runbook was written for – and they’ve already taken an action that was correct in the wrong scenario.</p> <p>The most recognizable form of this failure: the system breaks at 3am, the engineer on call can’t resolve it, and everyone waits until 8am for the original developer to arrive. The runbook exists. The SLA doesn’t care.</p> <p>The runbook writer’s temptation: assume the reader has context. They don’t. They have adrenaline and a phone. Assume neither.</p> <hr/> <h2 id="anatomy-of-a-runbook--seven-sections-always">Anatomy of a runbook – seven sections, always</h2> <p>Every runbook has the same seven sections, in the same order. Consistency matters because the 3am engineer is scanning, not reading.</p> <div class="language-markdown highlighter-rouge"><div class="highlight"><pre class="highlight"><code><span class="gh"># OPS-LOCK-01 -- Scheduler Lock Not Released</span>

<span class="gu">## Scope limits</span>
This runbook covers one scenario: a stale scheduler lock where the
load is confirmed NOT running. If the load IS running (active RunID
in control.NotebookLog), STOP -- do not release. If the release does
not unblock the scheduler within 10 minutes, see OPS-RETRY-01.
This runbook does NOT diagnose why the lock was never released.
For recurring patterns (3+ in 7 days), see GOV-POST-MORTEM-01.

<span class="gu">## Symptom</span>
<span class="p">-</span> Alert: SchedulerLocks shows IsLocked=true, LockAcquiredTime more
  than 2x the longest expected run duration.
<span class="p">-</span> Downstream effect: load has not fired on its expected cadence.
<span class="p">-</span> Typical page: "OPS-LOCK-01: Sales_Salesforce stuck for 4h 12m"

<span class="gu">## Diagnosis</span>
Run this query to confirm the lock is stale:<span class="sb">

    SELECT LoadKey, IsLocked, LockAcquiredTime, LockReleasedTime,
           TIMESTAMPDIFF(MINUTE, LockAcquiredTime, current_timestamp())
             AS age_minutes
    FROM control.SchedulerLocks
    WHERE LoadKey = '&lt;LoadKey from alert&gt;';

</span>If LockReleasedTime is NULL and age_minutes &gt; 120, proceed to Action.
If age_minutes is under 120, the load may still be running -- STOP,
check control.NotebookLog for an active RunID before releasing.

<span class="gu">## Action</span>
Release the lock with an explicit reason:<span class="sb">

    UPDATE control.SchedulerLocks
    SET IsLocked = false,
        LockReleasedTime = current_timestamp(),
        ReleasedReason = 'OPS-LOCK-01: stale lock, RunID &lt;X&gt; failed at &lt;ts&gt;'
    WHERE LoadKey = '&lt;LoadKey&gt;' AND IsLocked = true;

</span>Replace <span class="nt">&lt;X&gt;</span> with the failed RunID from control.NotebookLog.

<span class="gu">## Audit trail</span>
<span class="p">-</span> ReleasedReason must reference OPS-LOCK-01 explicitly (grep-able later).
<span class="p">-</span> Open an incident ticket and link this execution.
<span class="p">-</span> If this is the 3rd OPS-LOCK-01 in 7 days for the same LoadKey, escalate.

<span class="gu">## Escalation</span>
<span class="p">-</span> Primary: @oncall-data (Teams channel #data-oncall)
<span class="p">-</span> Secondary: @platform-lead (Teams DM)
<span class="p">-</span> If OPS-LOCK-01 repeats (3+ in 7 days), open a post-mortem.

<span class="gu">## Rollback</span>
Not applicable. Releasing a stale lock has no undo -- the scheduler
will re-acquire a new lock normally on the next cycle. If the load
fires after release and produces unexpected row counts, see OPS-VALIDATE-01.
</code></pre></div></div> <p>Seven sections, why this order:</p> <p><strong>Scope limits</strong> is the most underrated section in the set. It tells the engineer where this runbook ends. Without it, the engineer stretches the runbook into scenarios it wasn’t designed for – and takes actions that were correct in a different situation. Scope limits lets you exit in 30 seconds without executing a single step. Every other section assumes you stayed.</p> <p><strong>Symptom, Diagnosis, Action</strong> do the obvious work: confirm the scenario, prevent executing the action in the wrong one, and give parameterized SQL that runs in place against the attached lakehouse.</p> <p><strong>Audit trail</strong> is what separates an unlock from an unlogged intervention. Six months later, when someone queries the lock history, the reason is there in plain text – not in someone’s memory.</p> <p><strong>Escalation</strong> lets the engineer hand off without guilt. A named person, a channel, a condition. Not “ask the team” – that’s not escalation, that’s a shrug in writing.</p> <p><strong>Rollback</strong> closes the loop: can this be undone? For purge operations and destructive schema changes, the honest answer is <em>no</em>, and the runbook says so explicitly. “Not applicable – deleted data cannot be recovered” is the most important sentence a runbook about data deletion can contain. Writing it forces the author to confront the irreversibility before the action is taken, not after.</p> <p>Every runbook. Every time. No skipping “Audit trail” because “it’s obvious.” At 3am nothing is obvious.</p> <p>OPS-LOCK-01 references three other runbook IDs: OPS-RETRY-01 (when lock release doesn’t unblock the load and a retry is needed), GOV-POST-MORTEM-01 (when the same lock recurs enough times to warrant pattern investigation rather than another incident response – GOV rather than OPS because the output is a formal governance artifact, not an operational action), and OPS-VALIDATE-01 (when you need to assess the state of a recovery before declaring it complete). None of them are shown here – that’s the point. Runbooks in a library form a network of cross-references, not a flat list. Each one is bounded; the network covers the full scenario space. OPS-LOCK-01 tells you everything you need to release a stale lock. It doesn’t try to be everything else.</p> <hr/> <h2 id="three-kinds-of-runbooks-one-discipline">Three kinds of runbooks, one discipline</h2> <p>Not all runbooks take the same kind of action. Three types, same seven-section anatomy.</p> <p><strong>Executable runbooks.</strong> SQL, shell, or Python cells the engineer runs in place. OPS-LOCK-01 is executable: in 95% of cases the right action is identical. These are the majority and the ones most worth writing first.</p> <p><strong>Narrative runbooks.</strong> Judgment-heavy. Decision trees. CFG-DATE-FIX-01 – deciding whether to extend <code class="language-plaintext highlighter-rouge">parquet_date_fix</code> to a new column – is narrative: three sequential diagnostic questions, each branching, because a wrong answer can silently corrupt data downstream. The structure forces the judgment instead of hiding it.</p> <p><strong>Diagnostic runbooks.</strong> Read-only. No Action section. The goal is not to fix anything – it’s to produce a structured assessment that routes the engineer to the right runbook. OPS-VALIDATE-01, for example, looks like this:</p> <div class="language-markdown highlighter-rouge"><div class="highlight"><pre class="highlight"><code><span class="gh"># OPS-VALIDATE-01 -- Assess State of a Failed Run</span>

<span class="gu">## Scope limits</span>
Read-only. This runbook makes no changes. Use it to determine
which recovery runbook applies before taking any action.

<span class="gu">## Procedure</span>
<span class="p">1.</span> Retrieve the RunID from control.NotebookLog for the failed window.
<span class="p">2.</span> Check: did the ingestion notebook complete? (status = Failed or Partial?)
<span class="p">3.</span> Check: are there orphaned locks in SchedulerLocks for this RunID?
<span class="p">4.</span> Check: did post-ingestion tasks fire? (volume check, schema capture, publish)
<span class="p">5.</span> Map results to the decision table below.

<span class="gu">## Decision table</span>
| Ingestion  | Lock present | Post-ingestion | → Use        |
|------------|-------------|----------------|--------------|
| Failed     | Yes          | Not fired      | OPS-LOCK-01, then OPS-RETRY-01 |
| Partial    | No           | Not fired      | OPS-RETRY-01 (partial path) |
| Success    | No           | Failed         | OPS-POST-TASK-01 |
| Success    | No           | Success        | No recovery -- investigate upstream |

<span class="gu">## Rollback</span>
Not applicable. This runbook performs no changes.
</code></pre></div></div> <p>Its output is a routing decision, not a fix – the triage layer that prevents the most expensive 3am mistake: running the right runbook for the wrong scenario. Diagnostic runbooks are the most underbuilt category in most libraries, and the most valuable before you commit to any action.</p> <p>The seven-section anatomy applies to all three. Difference is weight distribution: executable runbooks have heavy Action; narrative runbooks have heavy Diagnosis with branching; diagnostic runbooks have heavy Diagnosis and Decision table with no Action at all. Same structure, different center of mass.</p> <hr/> <h2 id="where-runbooks-live">Where runbooks live</h2> <p>In this architecture, runbooks live inside the same Fabric workspace as the engine – not in a sibling repo, not in Confluence, not in SharePoint. Each runbook is itself a notebook: markdown cells for the seven sections, code cells for the SQL, typically attached to the same <code class="language-plaintext highlighter-rouge">lh_metadata</code> lakehouse the engine reads. The runbook doesn’t <em>describe</em> the control tables – it queries them. Whether this is the right choice for your platform depends on how your workspace is structured; the argument for it is the two properties that follow.</p> <p><strong>Versioned in Git.</strong> Every runbook change is a commit. PR-reviewed, diffable, blameable. A PR that changes the unlock logic in the engine can update the runbook in the same commit. The reviewer catches drift at review time, not at 3am. The YAML and its runbook evolve together because they live in the same PR discipline.</p> <p><strong>Alive and close to the operation.</strong> The runbook lives where the engineer already is. When OPS-LOCK-01 fires, the on-call engineer opens the OPS-LOCK-01 notebook in the same workspace – not a different tab, a different tool, a different login. The Diagnosis cell runs against <code class="language-plaintext highlighter-rouge">control.SchedulerLocks</code>. The Action cell releases the lock. Whatever SQL actually worked is already in the cell that ran – commit it. No “I’ll document it later.” Later never comes.</p> <hr/> <h2 id="governance-by-design">Governance by design</h2> <p><strong>The CFG vs OPS boundary.</strong></p> <p>In a production runbook library, one distinction turns out to be load-bearing: configuration runbooks versus operational runbooks. The difference isn’t what they do – it’s the governance model they carry.</p> <p><strong>CFG runbooks</strong> document proactive changes to the declared state of the system: YAML edits, schema changes, scheduler entries. Changes you decide to make before something breaks. Because they’re proactive, they carry the full governance stack: a PR that can be reviewed and approved, a diff that shows exactly what changed and why, a <code class="language-plaintext highlighter-rouge">git revert</code> that undoes it cleanly if something goes wrong. Someone signed off before the change landed.</p> <p><strong>OPS runbooks</strong> document reactive operations on running instances: retrying a failed run, releasing a lock, reprocessing a partition. Actions you take because something already went wrong. Because they’re reactive, their governance model is different – not approval before the action, but registration after it. <code class="language-plaintext highlighter-rouge">ReleasedReason</code> required. Incident ticket linked. Audit trail mandatory. The runbook doesn’t ask permission; there’s no time for that at 3am. It requires proof.</p> <p>The boundary matters because the wrong category produces the wrong instinct. An engineer who sees an ingestion failure and edits the YAML directly is applying CFG governance to an OPS problem – the fix might work once and create config drift that nobody connects to last week’s incident because the change never went through review. The category structure keeps that instinct in check: a YAML change goes through a CFG runbook, which means a PR, which means a reviewer.</p> <p>In a mature library, OPS runbooks frequently close with: <em>“If this pattern recurs, open a CFG runbook to address the root cause.”</em> The OPS runbook registers today’s action. The CFG runbook prevents tomorrow’s incident.</p> <p><strong>The prefix as operational metadata.</strong></p> <p>The runbook ID prefix is not a filing convention. It’s metadata that carries governance signal before you read a single word of the runbook.</p> <p><strong>CFG-</strong> and <strong>OPS-</strong> carry the governance models defined above – full-stack and registration-based respectively. The ones that actually change your risk exposure are the three most libraries declare and never get around to writing:</p> <p><strong>SEC-</strong> marks security operations: access grants, service principal rotation, permission revocations. Two things set it apart from OPS. The actions often have regulatory exposure and can be partially or fully irreversible. And unlike OPS – where you register after acting – SEC requires a named approver in the escalation path. A SEC runbook without one isn’t a governance oversight; it’s a missing prerequisite. You’ll find that out during the incident, not before.</p> <p><strong>DQ-</strong> marks data quality operations: validation assessments, quarantine decisions, profiling runs that feed the governance record. DQ runbooks have two audiences: the on-call engineer executing them and the data steward reviewing the weekly quality report. The audit trail they produce outlives the incident that triggered them.</p> <p><strong>GOV-</strong> marks formal compliance evidence: runbooks that exist to document procedures for external audits, regulatory reviews, or certifications. The risk of a missing GOV runbook isn’t operational – it surfaces when an auditor asks for evidence and the team discovers they have an index entry but not the runbook behind it.</p> <p>The index, structured by prefix, is a coverage map. An entry reading “SEC-REVOKE-01 – Revoke Compromised Service Account: not yet documented” is more than a missing page – it’s a named governance gap. The security domain has known operations without a defined procedure. That’s more useful than a library that doesn’t acknowledge the gap. The risk is visible; someone owns the decision not to write it yet.</p> <p>This is the same principle that made <code class="language-plaintext highlighter-rouge">Sales_Salesforce.yml</code> more than a naming convention in Post 1: a governance contract compressed into a string. The runbook ID prefix does the same work for the operations library – it encodes governance domain, ownership model, and risk profile before you open the file. That structure is load-bearing: it determines what governance model applies at the moment an engineer opens the runbook, not after they’ve read it.</p> <p><strong>The LLM angle – the 2026 payoff.</strong></p> <p>Runbooks as notebooks, versioned in Git, living in the workspace, become something more than operator documentation. A model with retrieval access to the corpus knows the exact SQL, the exact escalation path, the exact scope limits for every known failure mode on this platform. Not generic SRE advice. Specific, ground-truth guidance for this engine.</p> <p>When the on-call engineer asks an LLM “what’s OPS-LOCK-01?”, the model pulls the current runbook from the workspace – not a training snapshot from six months ago. The same Git discipline that keeps the runbook correct for humans keeps it correct for the model. After resolving an incident, the model can propose a PR that adds the new diagnosis step to the runbook. The human reviews and merges. Knowledge compounds.</p> <hr/> <h2 id="when-runbooks-retire--and-when-they-should-have-existed-sooner">When runbooks retire – and when they should have existed sooner</h2> <p>Runbooks and the engine are in a conversation. When a runbook fires too often, its pattern should migrate into the YAML. When the engine changes, the runbook evolves in the same PR.</p> <p>Before <code class="language-plaintext highlighter-rouge">parquet_date_fix</code> existed, there was <code class="language-plaintext highlighter-rouge">OPS-LEGACY-DATES-01</code>. Symptom: load fails with <code class="language-plaintext highlighter-rouge">INCONSISTENT_BEHAVIOR_CROSS_VERSION.READ_ANCIENT_DATETIME</code>. Diagnosis: find the offending column from the stack trace. Action: manual SQL to nullify rows before 1900, rerun, verify. It worked. It passed the 3am test.</p> <p>It also fired three times in one quarter, across three different sources, each with slightly different columns. Every incident left the same pattern: the engine didn’t know this source had placeholder dates; a human re-taught it each time.</p> <p>That’s the retirement trigger. A runbook that fires this often is not a documentation problem – it’s an engine gap. The YAML grew a <code class="language-plaintext highlighter-rouge">parquet_date_fix</code> block. The manual SQL became declarative config. <code class="language-plaintext highlighter-rouge">OPS-LEGACY-DATES-01</code> was archived with a pointer: <em>“Retired: this scenario is now handled declaratively.”</em> What replaced it – CFG-DATE-FIX-01 – is narrower: not “how to fix this emergency” but “how to decide whether to extend the existing declarative fix.” Scope shrank because the engine got smarter.</p> <p>Runbooks aren’t documentation. They’re pending engine features. Every runbook that fires is evidence that the engine hasn’t learned that failure mode yet. The goal isn’t more runbooks – it’s the right set of runbooks, each firing at a rate that justifies not absorbing it into the contract.</p> <p><strong>The gap the post-mortem finds.</strong></p> <p>The inverse problem is harder. A runbook that should have existed before the system went to production, and didn’t.</p> <p>Here’s how it shows up. A production platform has three capacity runbooks: one for monitoring consumption, one for diagnosing saturation, one for scaling the compute tier. On paper, the chain looks complete. In practice, it has a gap nobody noticed during design. Scaling requires approval – budget, process, a phone call. At 3am, when consumption is maxed and approvals are pending, you need a fourth runbook: what do you do <em>while you wait</em>? Which loads can you pause without missing SLAs? Which entities can defer to the next window? How do you drain the backlog once capacity is restored?</p> <p>That runbook was in the index but never written. The engineer at 3am improvises – making judgment calls about which loads to pause that aren’t theirs to make, documenting nothing because there’s nothing to document against. The next engineer improvises differently.</p> <p>The chain from detection to mitigation has a gap right before the decision that requires authority. Nobody writes the bridge runbook because writing it would require deciding who has the authority to deprioritize which loads – a political question the team deferred. The runbook gap is a proxy for the decision gap. Closing it requires both.</p> <p><strong>The day-one problem.</strong></p> <p>Even when all operational runbooks exist, there’s a failure mode nobody writes for: a new engineer needing to provision a new environment from scratch. The runbooks for individual operations exist. The onboarding sequence – which workspace to create first, which identity to configure before the first ingestion can run, which CFG runbook applies before any OPS runbook is relevant – is nowhere.</p> <p>In one platform, the security runbook required as the prerequisite for all ingestion access had been declared in the index but never written. The engineer couldn’t proceed without calling the person who built the system.</p> <p>A runbook library that only operates correctly when its author is available isn’t infrastructure. It’s documentation with a dependency.</p> <hr/> <h2 id="the-two-contracts">The two contracts</h2> <p>The first four posts built the contract with the engine. The YAML tells the engine what to do. Yamale validates that the YAML is well-formed. The scheduler tells the engine when. The partition strategy tells the engine how to recover. All of that is about making the machine behave.</p> <p>This post is about the contract with the <strong>operator</strong>. At 3am, when the machine has done everything it can and still needs a human, the only question is whether that human has the instruction they need, in the place they need it, with the context they need.</p> <p>Post 4’s scars produced both contracts simultaneously. <code class="language-plaintext highlighter-rouge">parquet_date_fix</code> in the YAML absorbed what the engine can now handle without human intervention. OPS-LOCK-01, CFG-DATE-FIX-01, OPS-IDEMPOTENCY-01, CFG-SYNC-01 hold what still requires a human – and wait for the day they can retire too. The scars aren’t just history. They’re load-bearing. Every field in every YAML that solves a compatibility problem, every runbook ID that maps an alert to a procedure – those are lessons the system learned in production, encoded into artifacts that outlast the team that learned them.</p> <p>That’s the dual nature of a runbook: simultaneously the product of a past failure and the prevention infrastructure for the next one – and what you retire into the YAML when the engine has finally learned the lesson.</p> <p>“Runbooks as infrastructure” sounds bureaucratic. What it means in practice: treat the thing that keeps the system running at 3am with the same engineering rigor you apply to the code that runs during the day. Put it in the workspace with everything else. Version it. Review it. Scope it explicitly. Wire it to the alert that pages the engineer. Let the LLM read it as ground truth. And when the same runbook fires too often, stop polishing the runbook – fix the engine.</p> <p>The best outcome for a runbook is eventually not needing it.</p> <p>Every scar that generated a runbook is evidence the system is learning. Every runbook that retires into the YAML is evidence it learned.</p> <hr/> <h2 id="whats-next">What’s next</h2> <p><strong>Post 6 – Living Metadata:</strong> Every runbook execution above generated data. Those control tables paged engineers and fixed incidents. They have a second life: dashboards, quality reports, governance scorecards. One source, three audiences.</p> <hr/> <p><em>This is the fifth post in the series “YAML Metadata-Driven Ingestion.” These patterns are drawn from several enterprise Lakehouse implementations and are platform-agnostic, though our reference stack is Microsoft Fabric.</em></p>]]></content><author><name></name></author><category term="yaml-ingestion"/><category term="runbooks"/><category term="operations"/><category term="devops"/><category term="documentation"/><category term="microsoft-fabric"/><summary type="html"><![CDATA[The 3am test, and why the instruction for a human is engineering, not documentation]]></summary></entry><entry><title type="html">Battle Scars</title><link href="https://javierloria.com/blog/2026/battle-scars/" rel="alternate" type="text/html" title="Battle Scars"/><published>2026-04-25T09:00:00+00:00</published><updated>2026-04-25T09:00:00+00:00</updated><id>https://javierloria.com/blog/2026/battle-scars</id><content type="html" xml:base="https://javierloria.com/blog/2026/battle-scars/"><![CDATA[<p><img src="/assets/img/feat-battle-scars.jpg" alt="Battle Scars"/></p> <p>Open a tap and water comes out. The first three posts in this series were about building the infrastructure behind that tap – a YAML-driven ingestion platform for a Lakehouse Bronze layer: a fixed engine plus N entity configuration files, metadata that governs metadata, a scheduler that turns freshness into a contract. The design is sound. The tests pass. The inspector signs off.</p> <p>Then winter comes.</p> <p>The pipes freeze. A gasket cracks. Someone upstream closes a valve nobody documented. A Spark runtime upgrade quietly breaks dates that have been loading fine for two years. A load finishes <code class="language-plaintext highlighter-rouge">PartialSuccess</code> and now you have half a day of data with no clean way to know which half. Post 3 ended with a warning: a process crashes at 2:00 am without releasing its lock and silently blocks an entire domain until someone notices at 9:00 am. This post starts there – and adds three more failure modes that arrived the same way: without warning, in production, on a Thursday.</p> <p>None of this was on the diagram. All of it showed up in production.</p> <p>This post is about four scars from real Lakehouse implementations – the ones that show up regardless of source, scale, or team. Not because scars are clever – they aren’t. But because the test of a metadata-driven platform is not whether it avoids them. It’s whether each one lands back in the <strong>contract</strong> – a new YAML field, a new partition strategy, an audit column, a runbook – instead of a one-off patch buried in a notebook.</p> <p>The Japanese have a name for that distinction: <em>kintsugi</em> – repairing broken pottery with gold lacquer instead of invisible adhesive, so the crack stays visible and becomes part of the object’s history. Every scar in this post is either gold (a declared YAML field, a documented partition strategy, a runbook in Git) or invisible adhesive (a patch in a notebook that holds until it doesn’t, and nobody remembers it’s there).</p> <p>An architecture without scars isn’t good design. It’s low usage. Boring is earned, not designed – and this post is about the earning.</p> <hr/> <h2 id="a-brief-detour-the-control-schema">A brief detour: the control schema</h2> <p>Three control tables appear in the scars below – operational metadata generated by the platform itself, never hand-edited. Post 6 covers the full catalog; for the four scars, these three are the cast:</p> <ul> <li> <table> <tbody> <tr> <td><strong><code class="language-plaintext highlighter-rouge">control.NotebookLog</code></strong> – one row per notebook execution (one notebook per <code class="language-plaintext highlighter-rouge">LoadKey = {Domain}_{Source}</code>, ingesting all entities declared in that YAML). Columns: RunID, LoadKey, Status (<code class="language-plaintext highlighter-rouge">Success</code></td> <td><code class="language-plaintext highlighter-rouge">Failed</code></td> <td><code class="language-plaintext highlighter-rouge">PartialSuccess</code>), RowCount, StartTime, EndTime, ErrorMessage. The notebook’s output payload – persisted alongside the run – carries entity-level detail: <code class="language-plaintext highlighter-rouge">total_entities</code>, per-status counts (<code class="language-plaintext highlighter-rouge">updated</code> / <code class="language-plaintext highlighter-rouge">no_changes</code> / <code class="language-plaintext highlighter-rouge">errors</code>), and per-entity error breakdowns. Written by every ingestion notebook on completion.</td> </tr> </tbody> </table> </li> <li><strong><code class="language-plaintext highlighter-rouge">control.SchedulerLocks</code></strong> – one row per load. Lock state, owner RunID, acquire/release timestamps, release reason. Detailed schema in Scar #3.</li> <li><strong><code class="language-plaintext highlighter-rouge">control.VolumeCheckQuarantine</code></strong> – anomalies detected by the volume-check post-ingestion task. Used implicitly in Scar #2’s <code class="language-plaintext highlighter-rouge">PartialSuccess</code> diagnosis.</li> </ul> <p>These three live in a <code class="language-plaintext highlighter-rouge">control</code> schema separate from the Bronze data schemas (<code class="language-plaintext highlighter-rouge">Sales_Salesforce</code>, etc.). Why: governance access lists for control data diverge from those for business data, and a separate schema makes that boundary easy to enforce.</p> <hr/> <h2 id="battle-scar-1--when-spark-versions-disagree-about-dates">Battle Scar #1 – When Spark versions disagree about dates</h2> <p><strong>The symptom.</strong> A load that had been running without incident for months starts failing:</p> <div class="language-plaintext highlighter-rouge"><div class="highlight"><pre class="highlight"><code>INCONSISTENT_BEHAVIOR_CROSS_VERSION.READ_ANCIENT_DATETIME
</code></pre></div></div> <p><strong>The cause.</strong> Spark 3.x – the Fabric runtime version – applies the Proleptic Gregorian calendar strictly. For Date columns read from Parquet, <code class="language-plaintext highlighter-rouge">spark.sql.parquet.datetimeRebaseModeInRead</code> defaults to <code class="language-plaintext highlighter-rouge">EXCEPTION</code>: any value before 1582-10-15 (the Gregorian calendar reform cutoff) triggers <code class="language-plaintext highlighter-rouge">READ_ANCIENT_DATETIME</code> on read. Earlier Spark runtimes read these values without complaint. The runtime upgraded; the data didn’t.</p> <p>The offending values weren’t legacy historical dates – they were corruption. A Date column carried <code class="language-plaintext highlighter-rouge">0008-01-01</code> for some rows, where the source system intended <code class="language-plaintext highlighter-rouge">2008-01-01</code>. Somewhere upstream a four-digit year had been truncated or mis-parsed into a single digit, written into Parquet, and propagated for months without anyone noticing – because every runtime before this one accepted year-8 dates silently. Spark 3.x doesn’t.</p> <p><strong>The tempting fix.</strong> Patch the notebook. Catch the exception, null out the offending columns, move on. Forty-five minutes of work, problem gone.</p> <p><strong>The fix we chose.</strong> A new direct field in the entity’s YAML – declared at the entity level, applied when the engine reads Parquet files previously staged in storage:</p> <div class="language-yaml highlighter-rouge"><div class="highlight"><pre class="highlight"><code><span class="na">parquet_date_fix</span><span class="pi">:</span>
  <span class="na">enabled</span><span class="pi">:</span> <span class="kc">true</span>
  <span class="na">columns</span><span class="pi">:</span> <span class="pi">[</span><span class="s2">"</span><span class="s">ACTDATE"</span><span class="pi">,</span> <span class="s2">"</span><span class="s">CREATEDATE"</span><span class="pi">]</span>
  <span class="na">cutoff_date</span><span class="pi">:</span> <span class="s2">"</span><span class="s">1900-01-01"</span>
  <span class="na">action</span><span class="pi">:</span> <span class="s2">"</span><span class="s">NULL"</span>
</code></pre></div></div> <p>The workaround is now <strong>declared</strong>, not hidden. Every YAML that inherits this problem declares it explicitly. A new engineer reading <code class="language-plaintext highlighter-rouge">Finance_LegacySystem.yml</code> sees <code class="language-plaintext highlighter-rouge">parquet_date_fix: enabled: true</code> and immediately understands this source has a known compatibility quirk. There is no <code class="language-plaintext highlighter-rouge">try/except</code> buried in a notebook for someone to stumble over in six months.</p> <p><strong>The gotcha inside the fix.</strong> In YAML, <code class="language-plaintext highlighter-rouge">action: NULL</code> without quotes is parsed as Python <code class="language-plaintext highlighter-rouge">null</code> by most Python parsers (PyYAML and anything built on it, including Yamale). The engine reads it as <code class="language-plaintext highlighter-rouge">None</code> and throws <code class="language-plaintext highlighter-rouge">action 'None' not implemented</code>. The correct form is <code class="language-plaintext highlighter-rouge">action: "NULL"</code> – a quoted string. One missing pair of quotes, perfectly valid YAML syntax, completely wrong behavior. The contract has its own type rules, and they are not always obvious.</p> <p><strong>What happens to the nullified values.</strong> The engine logs every nullified value to an audit table: RunID, column, original value, row identifier. If someone later asks whether <code class="language-plaintext highlighter-rouge">CREATEDATE</code> was really nullified for a specific record, the answer is a query, not a shrug. The cutoff is deliberately more conservative than Spark’s threshold. Spark rejects pre-1582 Date values; we null anything pre-1900. The reason is business: in this domain – enterprise transactional sources – a Date earlier than 1900 is corruption or an “unknown” sentinel, not history. A literal year-8 record is wrong. So is a record claiming the entity was created in 1850. Pulling the cutoff to 1900 turns the threshold from “Spark will fail” into “business has decided these values are unrecoverable” – and auditing them as nullified is more useful than letting them through. The one risk: if <code class="language-plaintext highlighter-rouge">cutoff_date</code> is set too high – <code class="language-plaintext highlighter-rouge">2000-01-01</code> instead of <code class="language-plaintext highlighter-rouge">1900-01-01</code> – legitimate business dates in the 20th century get nullified. The threshold is a judgment call that needs sign-off from someone who knows what those dates mean.</p> <p><strong>The lesson.</strong> Every compatibility workaround ends up in the contract. The engine doesn’t accumulate special cases for individual sources. The YAML grows a flag that says “this source has this known issue, apply this known treatment, log it this way.” When the upstream system is eventually fixed, flipping <code class="language-plaintext highlighter-rouge">enabled: false</code> is a one-line PR and the workaround disappears cleanly.</p> <p>Visible, reversible, auditable. Three properties that patches in notebooks never have.</p> <p>One detail that closes the loop with Post 2: adding <code class="language-plaintext highlighter-rouge">parquet_date_fix</code> required updating the Yamale schema. The field didn’t exist when the <code class="language-plaintext highlighter-rouge">.schema</code> file was written – any entity deploying it would have failed L4 validation before reaching the engine. One PR added <code class="language-plaintext highlighter-rouge">parquet_date_fix</code> as an optional block to the schema file; <code class="language-plaintext highlighter-rouge">template_version</code> incremented from <code class="language-plaintext highlighter-rouge">"1.0"</code> to <code class="language-plaintext highlighter-rouge">"1.1"</code>. YAML tolerates new sections gracefully – a notebook that doesn’t know about <code class="language-plaintext highlighter-rouge">parquet_date_fix</code> simply ignores it. But <code class="language-plaintext highlighter-rouge">template_version</code> isn’t about YAML tolerance. It ensures the engine reads the same contract that the schema validates and the deployed files declare. A version bump makes the change visible in the audit trail and gives the engine a hook to apply version-specific logic when needed. Entities that needed the fix declared it; entities that didn’t were untouched. The platform absorbed a new requirement with exactly the friction Post 2 designed for: one schema PR, validation before every deploy.</p> <p><em>Runbook CFG-DATE-FIX-01 covers flag activation and impact auditing. Retirement criteria and detection steps in Post 5.</em></p> <hr/> <h2 id="battle-scar-2--partial-failures-and-idempotency-by-snapshotdate">Battle Scar #2 – Partial failures and idempotency by SnapshotDate</h2> <p><strong>The symptom.</strong> A batch of several dozen domain-source loads runs across the schedule. Most notebooks complete cleanly. A handful return <code class="language-plaintext highlighter-rouge">PartialSuccess</code> – the notebook ran, but one of the entities inside it hit a network blip, a source timeout, or an intermittent driver error. <code class="language-plaintext highlighter-rouge">PartialSuccess</code> is a control-table status (<code class="language-plaintext highlighter-rouge">control.NotebookLog</code>), distinct from Fabric’s native pipeline statuses (<code class="language-plaintext highlighter-rouge">Succeeded | Failed | Cancelled</code>) which would mark the orchestration <code class="language-plaintext highlighter-rouge">Succeeded</code> regardless of internal failures.</p> <p><strong>Why this is worse than total failure.</strong> Total failure is clean. You retry, you recover. Partial failure leaves you with a half-loaded day of data. Now you have to know which entities failed, which ones succeeded, whether retrying would double-load the successes or only pick up the failures. The answer depends on whether your pipeline was designed for this question. Most aren’t.</p> <p><strong>The pattern that saved us: idempotency by SnapshotDate.</strong> Every ingestion is partitioned by <code class="language-plaintext highlighter-rouge">SnapshotDate</code>. A rerun for the same day <strong>replaces</strong> that partition – not appends, not merges, not deduplicates. Overwrites. Rerunning the whole batch is safe because the successes get rewritten identically and the failures get retried – provided the source produces the same data on retry. That holds for most batch extractions; it doesn’t hold for sources with rolling windows or stateful APIs, where a retry mid-window may pull different data than the original run. No rollback procedure, no “skip these, include those” orchestration:</p> <div class="language-python highlighter-rouge"><div class="highlight"><pre class="highlight"><code><span class="n">df</span><span class="p">.</span><span class="n">write</span><span class="p">.</span><span class="nf">mode</span><span class="p">(</span><span class="sh">"</span><span class="s">overwrite</span><span class="sh">"</span><span class="p">)</span> \
  <span class="p">.</span><span class="nf">option</span><span class="p">(</span><span class="sh">"</span><span class="s">partitionOverwriteMode</span><span class="sh">"</span><span class="p">,</span> <span class="sh">"</span><span class="s">dynamic</span><span class="sh">"</span><span class="p">)</span> \
  <span class="p">.</span><span class="nf">partitionBy</span><span class="p">(</span><span class="sh">"</span><span class="s">SnapshotDate</span><span class="sh">"</span><span class="p">)</span> \
  <span class="p">.</span><span class="nf">saveAsTable</span><span class="p">(...)</span>
</code></pre></div></div> <p>The engine validates partition layout against the YAML before every write; an existing table with a different layout fails with a pointer to runbook <code class="language-plaintext highlighter-rouge">CFG-PARTITION-FIX-01</code>.</p> <p><strong>Diagnosis stays simple.</strong> One query against <code class="language-plaintext highlighter-rouge">control.NotebookLog</code> tells you which three loads ended with <code class="language-plaintext highlighter-rouge">PartialSuccess</code>; the notebook’s output payload carries the per-entity breakdown – counts and error details for each entity inside the notebook. You don’t need to dig through Fabric’s native pipeline logs. Your own control tables were built for exactly this question.</p> <p><strong>The lesson.</strong> Idempotency isn’t a feature you add later. It’s a partition-key decision you make on day one. Get it right, and partial failures become retry problems – cheap. Get it wrong, and they become consistency problems – expensive. The difference between the two is roughly the difference between “rerun the pipeline” and “call a meeting.”</p> <p><strong>The honest boundaries.</strong> Two boundaries are worth naming. First, idempotency by overwrite depends on the source producing the same data on retry – rolling windows, stateful APIs, and sources that re-publish past data with corrections break that assumption. The partition gets reproduced cleanly, but its semantic content changes. Second, the Delta guarantees only hold while the contract is intact: an external process touching parquet files directly, an <code class="language-plaintext highlighter-rouge">append</code> mode left in by accident, a VACUUM with retention below the active log range – all of these put the table into states where <code class="language-plaintext highlighter-rouge">DELETE WHERE SnapshotDate = '{date}'</code> followed by a rerun is the recovery path. These aren’t edge cases of partition overwrite; they’re consequences of bypassing the contract that makes partition overwrite work.</p> <p><em>Runbook OPS-IDEMPOTENCY-01 covers PartialSuccess diagnosis, the safe rerun procedure, and the recovery paths when the Delta contract was bypassed.</em></p> <hr/> <h2 id="battle-scar-3--when-the-guard-lock-outlives-the-guard">Battle Scar #3 – When the guard lock outlives the guard</h2> <p><strong>The symptom.</strong> The scheduler refuses to trigger a load. <code class="language-plaintext highlighter-rouge">control.SchedulerLocks</code> shows the load is locked. The process that acquired the lock crashed two hours ago. The lock is still there.</p> <p><strong>Why we have locks at all.</strong> Two scheduler runs can’t touch the same load simultaneously. If a load is mid-flight when the scheduler evaluates again, bad things happen: duplicate writes, racing metadata updates, orphaned batches. The lock is a single-writer guarantee. Post 3 introduced this consequence as an inherent property of the scheduler design.</p> <p><code class="language-plaintext highlighter-rouge">control.SchedulerLocks</code> holds one row per load:</p> <div class="language-sql highlighter-rouge"><div class="highlight"><pre class="highlight"><code><span class="c1">-- control.SchedulerLocks (one row per LoadKey)</span>
<span class="n">LoadKey</span>              <span class="n">STRING</span>     <span class="c1">-- {Country}_{Domain}_{Source}</span>
<span class="n">IsLocked</span>              <span class="nb">BOOLEAN</span>    <span class="c1">-- true while load is running</span>
<span class="n">LockAcquiredTime</span>      <span class="nb">TIMESTAMP</span>
<span class="n">LockOwnerRunID</span>        <span class="n">STRING</span>     <span class="c1">-- PipelineRunID holding the lock</span>
<span class="n">LockOwnerExecutionID</span>  <span class="n">STRING</span>     <span class="c1">-- ExecutionID holding the lock</span>
<span class="n">LockReleasedTime</span>      <span class="nb">TIMESTAMP</span>  <span class="c1">-- null while locked</span>
<span class="n">ReleasedReason</span>        <span class="n">STRING</span>     <span class="c1">-- null while locked; required on manual release</span>
<span class="n">LastUpdated</span>           <span class="nb">TIMESTAMP</span>
</code></pre></div></div> <p><strong>Why the lock outlived the writer.</strong> The process didn’t release cleanly – network interrupt, Fabric session timeout, cluster eviction. The cleanup code was in a <code class="language-plaintext highlighter-rouge">finally</code> block that never ran. The lock is now a zombie.</p> <p><strong>The escape hatch.</strong> Before executing, confirm in the pipeline monitor that no execution is currently active for this load. Releasing a lock while the process is still running creates exactly the race condition the lock was supposed to prevent.</p> <div class="language-sql highlighter-rouge"><div class="highlight"><pre class="highlight"><code><span class="k">UPDATE</span> <span class="n">control</span><span class="p">.</span><span class="n">SchedulerLocks</span>
<span class="k">SET</span> <span class="n">IsLocked</span> <span class="o">=</span> <span class="k">false</span><span class="p">,</span>
    <span class="n">LockReleasedTime</span> <span class="o">=</span> <span class="k">current_timestamp</span><span class="p">(),</span>
    <span class="n">ReleasedReason</span> <span class="o">=</span> <span class="p">:</span><span class="n">reason</span>
<span class="k">WHERE</span> <span class="n">LoadKey</span> <span class="o">=</span> <span class="p">:</span><span class="n">load_key</span>
  <span class="k">AND</span> <span class="n">IsLocked</span> <span class="o">=</span> <span class="k">true</span>
  <span class="k">AND</span> <span class="n">LockOwnerRunID</span> <span class="o">=</span> <span class="p">:</span><span class="n">run_id</span><span class="p">;</span>
</code></pre></div></div> <p>The release utility binds <code class="language-plaintext highlighter-rouge">:load_key</code>, <code class="language-plaintext highlighter-rouge">:run_id</code>, and <code class="language-plaintext highlighter-rouge">:reason</code> as parameters – not string-formatted values. The operator supplies <code class="language-plaintext highlighter-rouge">:reason</code> interactively when invoking the utility. The <code class="language-plaintext highlighter-rouge">LockOwnerRunID</code> filter ensures you’re releasing the specific lock you diagnosed, not a lock another process may have acquired between your diagnosis and your update.</p> <p>This is deliberately manual. Deliberately loud. <code class="language-plaintext highlighter-rouge">ReleasedReason</code> is required, not optional – if someone unlocks a load, they say why. Six months later, when someone queries the lock history, the reason is there in plain text.</p> <p><strong>How long before a lock is a zombie?</strong> In our scenario, four hours was the practical threshold – if a lock has been held longer than that with no active execution showing in the pipeline monitor, it didn’t release cleanly. Under four hours, the process might still be running on unusual volume. The threshold is a scheduler parameter – calibrate it against your slowest normal load. The principle of manual release with an audit trail isn’t a parameter.</p> <p><strong>Why not auto-release with a timeout?</strong> We considered it. The risk: a load legitimately runs long – unusual volume, slow source – the timeout fires, the lock releases, the scheduler fires again. Now you have two concurrent loads. Manual release with a human in the loop is slower, but the frequency of zombie locks (rare, not routine) makes the cost acceptable. For something that happens once a month, certainty is worth the extra step.</p> <p><strong>The lesson.</strong> Distributed locks need explicit escape hatches, and the escape hatch has to leave an audit trail. An unlock without a reason is technical debt with a timestamp. An unlock with a reason is a log entry a future engineer can use to decide whether the original lock was acquired correctly in the first place.</p> <p><em>Runbook OPS-LOCK-01 covers zombie lock diagnosis (4h threshold), active-process verification, and manual release with required ReleasedReason.</em></p> <hr/> <h2 id="battle-scar-4--the-yaml-in-git-is-not-the-yaml-running">Battle Scar #4 – The YAML in Git is not the YAML running</h2> <p><strong>The symptom.</strong> A PR was merged that modified <code class="language-plaintext highlighter-rouge">Sales_Salesforce.yml</code>. The pipeline ran that night. The change didn’t take effect. Everyone reviewed the diff, approved the PR, confirmed the merge – and the pipeline behaved as if the change never happened.</p> <p><strong>The cause.</strong> The YAML in Git was updated. The YAML <strong>deployed to the Lakehouse</strong> – the one the engine actually reads at runtime – was the old one. The GitOps flow stopped at “merge.” The deployment was manual. And manual deployments are, eventually, forgotten.</p> <figure> <picture> <source class="responsive-img-srcset" srcset="/assets/img/yaml-deploy-drift-480.webp 480w,/assets/img/yaml-deploy-drift-800.webp 800w,/assets/img/yaml-deploy-drift-1400.webp 1400w," type="image/webp" sizes="95vw"/> <img src="/assets/img/yaml-deploy-drift.png" class="img-fluid rounded z-depth-1" width="100%" height="auto" data-zoomable="" loading="eager" onerror="this.onerror=null; document.querySelectorAll('.responsive-img-srcset').forEach(function (n) { n.remove(); });"/> </picture> </figure> <div class="caption">The YAML in Git is not the YAML running: a manual deploy step can leave the Lakehouse on an older config version, while an automated, commit-hash-tagged deploy keeps them in sync.</div> <p><strong>Why the deploy wasn’t automated from day one.</strong> It should have been. The honest answer: other priorities, and “merge → manual upload” worked for the overwhelming majority of cases. Scar #4 is about the exceptions. Post 1 states automated deployment as a starting principle – “The Lakehouse contains deployed artifacts, not editable ones” – because we learned it from this very scar.</p> <p><strong>The fix – a process before a tool.</strong></p> <ol> <li>PR with the YAML change.</li> <li>Pre-deploy Yamale validation (from Post 2).</li> <li>Manual upload to <code class="language-plaintext highlighter-rouge">Lh_Metadata/Files/config/</code> with a deployment checklist.</li> <li><strong>Smoke test with <code class="language-plaintext highlighter-rouge">entities_filter</code></strong> – the engine supports running a subset before committing to a full load: <div class="language-python highlighter-rouge"><div class="highlight"><pre class="highlight"><code><span class="n">entities_filter</span> <span class="o">=</span> <span class="p">[</span><span class="sh">"</span><span class="s">Opportunities</span><span class="sh">"</span><span class="p">]</span>  <span class="c1"># only this entity
# after validation:
</span><span class="n">entities_filter</span> <span class="o">=</span> <span class="bp">None</span>  <span class="c1"># all entities (Python None, not the string "none")
</span></code></pre></div> </div> </li> <li>Full run only after the filtered run confirms the change took effect.</li> <li>Runbook CFG-SYNC-01 documents all of this.</li> </ol> <p>Automating the deploy was the eventual goal – PR merge triggering an automatic copy to the Lakehouse folder, with the commit hash tagged in the deployed file. The process came first; the automation is still pending. Tools enforce process; they don’t create it – and process without tools is what we still rely on, scar and all.</p> <p>DMBOK Ch. 6 §4.3 (“Script Usage for All Changes”) frames the principle the slow way: every database change should be scripted, version-controlled, and reviewable. We learned it the fast way – by living a deploy gap and writing the runbook that closes it.</p> <p><strong>The lesson – and the hardest one.</strong> “Versioned in Git” is not the same as “running in production” until there’s a deployment mechanism you can point to. GitOps without CD creates a category of drift that is harder to detect than environment drift, because both sides look correct individually. The Git version is correct. The deployed version is correct – it just happens to be the previous one. When something breaks, the first question – “is the YAML I’m looking at the one that ran?” – cannot be answered confidently. The fix is boring: a deploy script, a commit-hash tag in the config file. The cost of not having it is enormous.</p> <p>Config drift has more than one dimension. The deployed/Git gap is the most visible, but there are others: entities enabled in YAML with no recent execution, entities enabled with no Delta table in the Lakehouse. Both can be spotted with a simple cross-reference: join deployed YAMLs against <code class="language-plaintext highlighter-rouge">control.NotebookLog</code> filtered to the last N days to find entities that are configured but never ran; join against the Lakehouse catalog to find entities that are configured but have no Delta table. All three share the same root – the YAML describes a world that isn’t the one actually running. The full consistency audit pattern is material for Post 6 (Living Metadata).</p> <figure> <picture> <source class="responsive-img-srcset" srcset="/assets/img/yaml-drift-signals-480.webp 480w,/assets/img/yaml-drift-signals-800.webp 800w,/assets/img/yaml-drift-signals-1400.webp 1400w," type="image/webp" sizes="95vw"/> <img src="/assets/img/yaml-drift-signals.png" class="img-fluid rounded z-depth-1" width="100%" height="auto" data-zoomable="" loading="eager" onerror="this.onerror=null; document.querySelectorAll('.responsive-img-srcset').forEach(function (n) { n.remove(); });"/> </picture> </figure> <div class="caption">Detecting config drift by cross-referencing deployed YAMLs, Git commit hashes, the NotebookLog, and the Lakehouse catalog.</div> <p><em>Runbook CFG-SYNC-01 covers the pre-deploy sequence: validation and the entities_filter smoke test. Deployment checklist and consistency audit triggers included.</em></p> <hr/> <h2 id="scars-as-teachers">Scars as teachers</h2> <p>Each scar above started as a production incident. Each one ended as a YAML field, a partition strategy, an audit column, or an entry in a runbook. None of them appear in the architecture diagrams. All of them are load-bearing.</p> <p>Post 1 said Bronze should be boring. Post 2 said metadata governs metadata. Post 3 said the scheduler makes freshness a contract. This post adds one more: <strong>every scar leaves behind either an artifact or folklore</strong>. The artifact is the gold – a YAML flag, a partition strategy, a runbook. Folklore is the invisible adhesive – what the senior engineer knows and the junior engineer learns by breaking things at 3:00 am.</p> <p>An architecture without scars is not one that got everything right on the first try. It’s one that hasn’t been stressed yet. The moment it meets real load, upstream changes, or a runtime surprise it didn’t plan for, it will start accumulating scars like every system that runs in production. The only question is which kind.</p> <p>Back to <em>kintsugi</em>. The philosophy is direct: breakage and repair are part of the object’s history, not something to hide or disguise. The repaired piece is more honest than the one that arrived intact. It carries its history on the surface.</p> <p>A data platform is no different. The patch buried in a notebook imitates the intact object: the crack exists but nobody sees it. <code class="language-plaintext highlighter-rouge">parquet_date_fix: enabled: true</code> in the YAML is the gold – the incompatibility is visible, declared, part of the contract. Runbook OPS-LOCK-01 is the gold – the scar has a name and a procedure; every execution leaves a reason in the log. These aren’t engineering embarrassments. They’re evidence of a system that learned something in production and brought it to the surface.</p> <p>Artifacts don’t happen by themselves. The YAML field captures the workaround. The partition strategy captures the failure mode. The runbook captures what a human should do when it happens again – what to check when the lock is stuck, when the deploy didn’t propagate, when a column’s dates stopped parsing. The contract captures what the engine should do differently. Both matter. Neither survives unless someone writes it down.</p> <hr/> <h2 id="whats-next">What’s next</h2> <p><strong>Post 5 – Runbooks as Infrastructure:</strong> Every scar above left behind not just a YAML field but a human-facing instruction: what the on-call engineer does when it happens again at 3:00 am. Those instructions are infrastructure, not documentation – versioned next to the engine, tested by the 3:00 am test, referenced by stable IDs from the control tables that paged the engineer in the first place. Why runbooks in Confluence rot, why runbooks in Git don’t, and what separates a runbook you can hand to someone without context from one that only the author can execute.</p> <p><strong>Post 6 – Living Metadata:</strong> Every scar in this post generated data. <code class="language-plaintext highlighter-rouge">parquet_date_fix</code> logs nullified values. <code class="language-plaintext highlighter-rouge">SchedulerLocks</code> records unlock reasons. <code class="language-plaintext highlighter-rouge">notebooklog</code> captures every partial failure. The control tables are full – but if nobody reads them, they’re dead metadata. How logs become reports, reports become decisions, and three different audiences (ops, quality, governance) end up consuming the same underlying data for three different purposes.</p> <hr/> <p><em>This is the fourth post in the series “YAML Metadata-Driven Ingestion.” The patterns described here have evolved across several enterprise Lakehouse implementations and are platform-agnostic, though our reference platform is Microsoft Fabric.</em></p>]]></content><author><name></name></author><category term="yaml-ingestion"/><category term="production"/><category term="spark"/><category term="lessons"/><category term="operations"/><category term="microsoft-fabric"/><summary type="html"><![CDATA[What happens when a YAML-driven platform meets production reality]]></summary></entry><entry><title type="html">The Scheduler’s Contract</title><link href="https://javierloria.com/blog/2026/the-schedulers-contract/" rel="alternate" type="text/html" title="The Scheduler’s Contract"/><published>2026-04-23T09:00:00+00:00</published><updated>2026-04-23T09:00:00+00:00</updated><id>https://javierloria.com/blog/2026/the-schedulers-contract</id><content type="html" xml:base="https://javierloria.com/blog/2026/the-schedulers-contract/"><![CDATA[<p><img src="/assets/img/feat-schedulers-contract.jpg" alt="The Scheduler's Contract"/></p> <p>Open a tap. Water comes out – boring, reliable, the way Post 1 described it. But Post 1 left a question open: <em>how old is the water?</em></p> <p>A tap that opens at the wrong time, or not at all, delivers stale data. An analyst who pulls <code class="language-plaintext highlighter-rouge">Sales_Opportunities</code> at 9:00 am and gets data from two days ago doesn’t have a pipeline problem. They have a freshness problem. A table called <code class="language-plaintext highlighter-rouge">Sales_Opportunities</code> is not a static artifact – it’s a snapshot of a moment that’s already passed. Every query is an answer to an implicit question: how old is this data? Can you promise – to an analyst, to a downstream pipeline, to a business process that depends on it – that the data is no more than four hours old? Or six? Do you know, or do you just hope?</p> <p>Hope is not a schedule.</p> <p>This post is about the component of a metadata-driven Bronze layer that nobody talks about until something breaks at 3:00 am: the scheduler. Not because it’s complex – it isn’t. It matters because it’s the part that turns data freshness from a property you discover after the fact into a freshness <strong>window</strong> you commit to in advance – not an exact timestamp, but a bounded promise.</p> <p>That “bounded” matters more than it sounds. The Lakehouse model is <em>BASE</em> – Basically Available, Soft state, Eventually consistent – not ACID. Bronze is expected to <em>converge</em> to source truth over time, not to reflect it at the instant a transaction commits. The scheduler’s contract is the operational expression of that consistency model: not when the data is exact, but how stale it’s allowed to be.</p> <h2 id="the-constraint-that-forces-the-design">The constraint that forces the design</h2> <p>Start with a simple reality. Native pipeline schedules in Microsoft Fabric work fine for a handful of pipelines on common cadences – attach a schedule, set the time, done. The limit appears when scheduling stops being just <em>when</em> and starts being <em>which-given-state</em>: “run Sales Salesforce on Tuesday at 04:00 <em>unless</em> Finance SAP is paused for migration, and stagger Marketing 30 minutes later because the gateway saturates otherwise.”</p> <p>Conditional logic across loads doesn’t belong in a scheduling UI. It belongs in a file – versionable, diffable, reviewable in a PR. Native schedules can tell a pipeline <em>when</em> to run; they can’t read the YAML that declares which loads are due, which are paused, which carry an offset, and which have to wait for a dependency to release a lock. That logic has to live somewhere outside the platform’s scheduling UI.</p> <p>There’s a secondary scaling issue worth naming. Fabric limits each pipeline to 20 attached schedules, a <a href="https://learn.microsoft.com/en-us/fabric/data-factory/pipeline-runs">documented platform constraint</a>. For a Lakehouse with 350+ loads across multiple sources, domains, and countries, that ceiling matters – but it’s not the reason native scheduling doesn’t fit. Even with no limit at all, you’d still need the YAML to carry the conditional logic. The 20-schedule cap is the symptom, not the cause.</p> <p>In a real Lakehouse – multiple sources, multiple domains, multiple countries – you have 350+ loads. You are not building 350 individual scheduled pipelines. That path leads to the same proliferation problem Post 1 opened with: 200 pipelines, each with its own schedule hardcoded in a portal, none of them visible in Git, none of them diffable, none of them auditable. You can’t answer “what changed and when?” and you can’t answer “what runs at 4:00 am and why?” without clicking through every pipeline manually.</p> <p>The metadata-driven solution is the same pattern applied here: one master pipeline that evaluates every few minutes which loads are due, and a single YAML file that declares the schedule for all of them. The complexity moves from the platform into a file where it belongs: versionable, reviewable, and writable in a text editor.</p> <h2 id="two-contracts-two-files">Two contracts, two files</h2> <p>The most important design decision in this post: the scheduler YAML is <em>never</em> the same file as the ingestion YAML.</p> <p>Post 1 introduced the ingestion YAML: <code class="language-plaintext highlighter-rouge">Sales_Salesforce.yml</code>, which declares <em>what</em> to ingest and <em>how</em>. The scheduler YAML – call it <code class="language-plaintext highlighter-rouge">_scheduler.yml</code> – declares <em>when</em>. They are two separate files because they answer two different questions, evolve at two different rates, and belong to two different audiences.</p> <p>The ingestion YAML changes when the data model changes: a new entity, a schema update, a new security tag. It’s a data engineering artifact.</p> <p>The scheduler YAML changes when the operational contract changes: a source goes offline, a load needs to run more frequently, a new business process requires intraday data. It’s an operational artifact. Ops teams with no interest in schema details still have opinions about timing windows and retry policies. In one of our implementations, Ops blocked the merge of a new Salesforce load because it was scheduled at 02:30 – the same gateway was already saturated with Marketing at that hour. The PR review surfaced a conversation that wouldn’t have happened if schedule and ingestion lived in the same file: we shifted the load to 03:15 and the merge went through.</p> <p>Mixing both concerns into a single file creates a merge conflict waiting to happen. Two separate files means two separate PRs, two separate reviewers, two separate cadences. The contract that governs <em>what</em> data is ingested stays decoupled from the contract that governs <em>when</em>.</p> <p>The same field name – <code class="language-plaintext highlighter-rouge">enabled</code> – means different things in each file: a business decision in the ingestion YAML (Data Owner sets it), an operational one in the scheduler (Ops sets it). The operational effect is the same – the load doesn’t run – but the owner and the approval chain differ.</p> <p>The two files carry different <a href="https://en.wikipedia.org/wiki/Responsibility_assignment_matrix">RACI</a> assignments:</p> <table> <thead> <tr> <th><strong>Dimension</strong></th> <th>Ingestion YAML</th> <th>Scheduler YAML</th> </tr> </thead> <tbody> <tr> <td><strong>Declares</strong></td> <td>What to ingest, how to classify</td> <td>When to run, retry policy</td> </tr> <tr> <td><strong>Responsible</strong></td> <td>Data Owner</td> <td>Operations</td> </tr> <tr> <td><strong>Informed</strong></td> <td>Operations</td> <td>Business</td> </tr> <tr> <td><strong>Changes when</strong></td> <td>Data model changes</td> <td>Operational contract changes</td> </tr> </tbody> </table> <h2 id="anatomy-of-the-scheduler-yaml">Anatomy of the scheduler YAML</h2> <p>Here is what a complete scheduler YAML looks like with English keys:</p> <div class="language-yaml highlighter-rouge"><div class="highlight"><pre class="highlight"><code><span class="c1"># File: _scheduler.yml</span>
<span class="c1"># Controls WHEN each load runs -- separate from WHAT and HOW</span>

<span class="na">timezone</span><span class="pi">:</span> <span class="s2">"</span><span class="s">America/Mexico_City"</span>
<span class="na">execution_window</span><span class="pi">:</span>
  <span class="na">interval_minutes</span><span class="pi">:</span> <span class="m">10</span>          <span class="c1"># Master pipeline polls every 10 min</span>

<span class="na">retry_policy</span><span class="pi">:</span>
  <span class="na">max_attempts</span><span class="pi">:</span> <span class="m">2</span>
  <span class="na">backoff_minutes</span><span class="pi">:</span> <span class="m">20</span>

<span class="na">loads</span><span class="pi">:</span>
  <span class="pi">-</span> <span class="na">domain</span><span class="pi">:</span> <span class="s">Sales</span>
    <span class="na">source</span><span class="pi">:</span> <span class="s">Salesforce</span>
    <span class="na">enabled</span><span class="pi">:</span> <span class="kc">true</span>
    <span class="na">schedule</span><span class="pi">:</span>
      <span class="na">type</span><span class="pi">:</span> <span class="s">weekly</span>
      <span class="na">day_of_week</span><span class="pi">:</span> <span class="s2">"</span><span class="s">Tuesday"</span>
      <span class="na">local_time</span><span class="pi">:</span> <span class="s2">"</span><span class="s">04:00"</span>

  <span class="pi">-</span> <span class="na">domain</span><span class="pi">:</span> <span class="s">Finance</span>
    <span class="na">source</span><span class="pi">:</span> <span class="s">SAP</span>
    <span class="na">enabled</span><span class="pi">:</span> <span class="kc">false</span>
    <span class="na">disable_reason</span><span class="pi">:</span> <span class="s2">"</span><span class="s">SAP</span><span class="nv"> </span><span class="s">S/4</span><span class="nv"> </span><span class="s">migration</span><span class="nv"> </span><span class="s">in</span><span class="nv"> </span><span class="s">progress</span><span class="nv"> </span><span class="s">--</span><span class="nv"> </span><span class="s">re-enable</span><span class="nv"> </span><span class="s">after</span><span class="nv"> </span><span class="s">cutover"</span>
    <span class="na">schedule</span><span class="pi">:</span>
      <span class="na">type</span><span class="pi">:</span> <span class="s">daily</span>
      <span class="na">local_time</span><span class="pi">:</span> <span class="s2">"</span><span class="s">02:00"</span>

  <span class="pi">-</span> <span class="na">domain</span><span class="pi">:</span> <span class="s">Operations</span>
    <span class="na">source</span><span class="pi">:</span> <span class="s">ERP</span>
    <span class="na">enabled</span><span class="pi">:</span> <span class="kc">true</span>
    <span class="na">schedule</span><span class="pi">:</span>
      <span class="na">type</span><span class="pi">:</span> <span class="s">intraday</span>
      <span class="na">interval_hours</span><span class="pi">:</span> <span class="m">4</span>
      <span class="na">window_start</span><span class="pi">:</span> <span class="s2">"</span><span class="s">06:00"</span>
      <span class="na">window_end</span><span class="pi">:</span> <span class="s2">"</span><span class="s">22:00"</span>

  <span class="pi">-</span> <span class="na">domain</span><span class="pi">:</span> <span class="s">Finance</span>
    <span class="na">source</span><span class="pi">:</span> <span class="s">Close</span>
    <span class="na">enabled</span><span class="pi">:</span> <span class="kc">true</span>
    <span class="na">schedule</span><span class="pi">:</span>
      <span class="na">type</span><span class="pi">:</span> <span class="s">monthly</span>
      <span class="na">day_of_month</span><span class="pi">:</span> <span class="m">1</span>
      <span class="na">local_time</span><span class="pi">:</span> <span class="s2">"</span><span class="s">03:00"</span>
      <span class="na">business_day</span><span class="pi">:</span> <span class="kc">true</span>   <span class="c1"># if the 1st falls on weekend, run the next business day</span>

  <span class="pi">-</span> <span class="na">domain</span><span class="pi">:</span> <span class="s">Marketing</span>
    <span class="na">source</span><span class="pi">:</span> <span class="s">WebAnalytics</span>
    <span class="na">enabled</span><span class="pi">:</span> <span class="kc">true</span>
    <span class="na">schedule</span><span class="pi">:</span>
      <span class="na">type</span><span class="pi">:</span> <span class="s">cron</span>
      <span class="na">expression</span><span class="pi">:</span> <span class="s2">"</span><span class="s">0</span><span class="nv"> </span><span class="s">3</span><span class="nv"> </span><span class="s">*</span><span class="nv"> </span><span class="s">*</span><span class="nv"> </span><span class="s">1-5"</span>   <span class="c1"># escape hatch: weekdays only at 03:00</span>
</code></pre></div></div> <p>Walk the sections:</p> <p><strong><code class="language-plaintext highlighter-rouge">timezone</code></strong> – All times in the file are local. The master pipeline converts to UTC internally. Every team that reads this file should be able to reason about “04:00” without doing mental timezone math. Use a single timezone for the whole file.</p> <p><strong><code class="language-plaintext highlighter-rouge">execution_window.interval_minutes</code></strong> – The master pipeline runs on a native Fabric schedule, every 10 minutes in this case. It wakes up, reads this YAML, evaluates which loads are due based on their schedule and last run time, and triggers them. The interval is the precision floor of your freshness guarantees: if a load is due at 06:00 and the pipeline runs at 05:58 and 06:08, it fires at 06:08. That 8-minute jitter is acceptable for daily loads. It matters more for intraday ones, which we’ll return to.</p> <p><strong><code class="language-plaintext highlighter-rouge">retry_policy</code></strong> – Two retry attempts, 20-minute backoff. Defined once, applies to all loads. The policy is centralized because retry behavior is a cross-cutting concern – the next section explains why it must live here and not in the individual notebooks.</p> <p><strong><code class="language-plaintext highlighter-rouge">loads</code></strong> – Each entry maps to one ingestion YAML: <code class="language-plaintext highlighter-rouge">domain</code> and <code class="language-plaintext highlighter-rouge">source</code> together form the lookup key. The orchestrator derives the filename as <code class="language-plaintext highlighter-rouge">{Domain}_{Source}.yml</code> – the same convention established in Post 1. No configuration table, no mapping file. The filename is the contract. The <code class="language-plaintext highlighter-rouge">enabled</code>/<code class="language-plaintext highlighter-rouge">disable_reason</code> pair is worth its own section below.</p> <p>Five schedule types cover the operational patterns we keep running into: <code class="language-plaintext highlighter-rouge">weekly</code>, <code class="language-plaintext highlighter-rouge">daily</code>, and <code class="language-plaintext highlighter-rouge">intraday</code> for steady cadences; <code class="language-plaintext highlighter-rouge">monthly</code> with a <code class="language-plaintext highlighter-rouge">business_day</code> flag for financial close and similar end-of-period loads (if the 1st of the month falls on a weekend, the load runs the next business day); and <code class="language-plaintext highlighter-rouge">cron</code> as an escape hatch for anything irregular – weekdays-only loads, quarter-end reports, the long tail of “we need this twice a year.” First-class types stay first-class because most production loads fall into them; <code class="language-plaintext highlighter-rouge">cron</code> exists so the YAML doesn’t grow a new top-level type every time Operations encounters something exotic.</p> <h2 id="retry-belongs-here-not-in-the-notebook">Retry belongs here, not in the notebook</h2> <p>A notebook can retry. You can wrap the ingestion loop in a <code class="language-plaintext highlighter-rouge">try/except</code>, catch transient errors, sleep, and re-attempt. Many teams do this.</p> <p>The problem: when each notebook manages its own retry, the behavior is inconsistent. Different notebooks have different retry counts, different backoff durations, different error categories they consider retryable. One has 3 attempts with 10-minute backoff. Another has 5 attempts with no backoff. A third has no retry at all. When something fails at 3:00 am, you’re not looking at one retry policy – you’re looking at whatever the person who wrote that notebook decided on that day.</p> <p>The scheduler centralizes the policy. One declaration governs all loads. If the policy changes – business decides 3 attempts is the new standard, or a source becomes flaky and needs extended backoff – you edit one YAML and one PR. Not fifty notebooks.</p> <p>The deeper principle: retry is not specific to a data source. It’s a cross-cutting concern about system reliability. Reliability concerns belong in the orchestration layer, not scattered across individual execution units. This is the same argument Infrastructure as Code makes about server provisioning – configuration that applies everywhere should live in one place, not be repeated with variations in every deployment manifest.</p> <p><strong>Why retry is uniform, not per-load.</strong> A reader might ask: what if one source is genuinely flaky and another isn’t? Shouldn’t we override retry on just the flaky one? No – and the reason is the one Post 1 used to defend <code class="language-plaintext highlighter-rouge">{Domain}_{Source}.yml</code> as a contract. The domain is the unit of operational consistency. Entities in the same YAML load together, fail together, retry together – they belong to the same operational baseline by design.</p> <p>This is a deliberate constraint, not a missing feature. Per-load retry overrides would turn the scheduler YAML from “this is how the platform retries” into “this is how each domain retries independently” – a contract becomes a collection. If a developer wants different retry for one domain, they have to create a new platform deployment, which implicitly creates a new operational boundary. That conversation – “is this really part of this platform, or is it something else?” – is exactly the conversation the architecture is supposed to surface.</p> <h2 id="enableddisablereason-audit-trail-not-just-a-toggle">Enabled/DisableReason: audit trail, not just a toggle</h2> <p>The Finance SAP entry above has <code class="language-plaintext highlighter-rouge">enabled: false</code>. Without context, that’s noise.</p> <p>With <code class="language-plaintext highlighter-rouge">disable_reason: "SAP S/4 migration in progress -- re-enable after cutover"</code>, it’s institutional memory – and the orchestrator propagates it. The entry isn’t removed from the registry; on every evaluation cycle, the master pipeline writes a skip event to the NotebookLog (Post 4’s control schema sidebar) carrying the same <code class="language-plaintext highlighter-rouge">disable_reason</code> string the YAML declares. The reason starts in the YAML and lands in every log entry the load skips. Six months from now, a new engineer opens the logs at 2:00 am because someone complained Finance data hasn’t updated since February. The answer is already there – in the YAML, and in every skip event between February and now. Nobody has to remember. Nobody has to dig through Slack history or ask the person who made the decision.</p> <p>This matters more because of who owns this file. Operations sets <code class="language-plaintext highlighter-rouge">enabled: false</code> – but Business is the Informed party. They depend on the data being available; when it isn’t, they need an explanation that doesn’t require a Slack thread, a ticket, or an escalation. <code class="language-plaintext highlighter-rouge">disable_reason</code> is that explanation, embedded in the contract itself. The engineer at 3:00 am can read it. So can the analyst who expected fresh data at 8:00 am.</p> <p>The rule: <strong><code class="language-plaintext highlighter-rouge">enabled: false</code> without <code class="language-plaintext highlighter-rouge">disable_reason</code> should fail your pre-merge validation.</strong> Post 2 split validation into two layers: Yamale for structural checks (declarative), the engine for conditional rules at runtime. This rule has an <code class="language-plaintext highlighter-rouge">if</code> in it – “if <code class="language-plaintext highlighter-rouge">enabled</code> is false, <code class="language-plaintext highlighter-rouge">disable_reason</code> is required” – so it doesn’t fit in the Yamale schema. But it also shouldn’t wait for runtime: a disabled load with no reason is a contract bug, and contract bugs belong pre-deploy. A small Python validator runs alongside Yamale in the same pre-deploy step – same code-not-schema principle as Post 2, just a different home. If you’re deliberately halting a production load, you owe the next engineer – and the 3:00 am version of yourself – an explanation. The reason isn’t optional. It’s part of the contract.</p> <p>What belongs in a disable reason: enough context to make a decision without escalating. “Disabled for testing” fails that bar. “SAP S/4 migration in progress – re-enable after cutover, coordinate with finance@” passes it.</p> <h2 id="intraday-loads-when-the-scheduler-becomes-critical-infrastructure">Intraday loads: when the scheduler becomes critical infrastructure</h2> <p>Daily loads are convenient. Intraday loads are where the scheduler stops being optional.</p> <p>Most Bronze loads in a typical Lakehouse run once a day or once a week. The scheduler is useful there, but the stakes are low – a missed trigger means stale data for hours, which is recoverable. Now add a load that runs every four hours. Or every 15 minutes.</p> <div class="language-yaml highlighter-rouge"><div class="highlight"><pre class="highlight"><code>  <span class="pi">-</span> <span class="na">domain</span><span class="pi">:</span> <span class="s">Inventory</span>
    <span class="na">source</span><span class="pi">:</span> <span class="s">WMS</span>
    <span class="na">enabled</span><span class="pi">:</span> <span class="kc">true</span>
    <span class="na">schedule</span><span class="pi">:</span>
      <span class="na">type</span><span class="pi">:</span> <span class="s">intraday</span>
      <span class="na">interval_hours</span><span class="pi">:</span> <span class="m">4</span>
      <span class="na">window_start</span><span class="pi">:</span> <span class="s2">"</span><span class="s">06:00"</span>
      <span class="na">window_end</span><span class="pi">:</span> <span class="s2">"</span><span class="s">22:00"</span>
</code></pre></div></div> <p>At <code class="language-plaintext highlighter-rouge">interval_hours: 4</code> with a 6:00 am–10:00 pm window, this load fires at 06:00, 10:00, 14:00, 18:00, and 22:00 – five times daily. Each run must complete, log its result, and release its lock before the next is due. The system tolerates a 10-minute jitter when data is expected once a week. It does not tolerate it when a warehouse replenishment process expects a snapshot every four hours.</p> <p>The scheduler’s <code class="language-plaintext highlighter-rouge">interval_minutes</code> (the master pipeline poll cadence) now matters. At 10 minutes, a due load fires within 10 minutes of its target time. Whether that’s acceptable depends on the downstream SLO. Ten minutes is the practical floor for batch – go lower and you’ve stopped doing batch.</p> <p>What is <strong>not</strong> a scheduler problem: loads where the run duration starts to approach the schedule interval. That line typically falls between 5 and 15 minutes, and it depends on three things – how long the load itself takes, how much jitter the downstream tolerates, and the evaluate-and-trigger overhead of the master pipeline. Once you cross it, you’re not in batch territory anymore: you’re paying batch overhead to chase a real-time problem. That belongs in streaming infrastructure – in Fabric, Eventstream.</p> <h2 id="the-scheduler-as-a-load-balancing-lever">The scheduler as a load-balancing lever</h2> <p>The scheduler answers “when” – but “when” is not purely a business question. It’s also an infrastructure question.</p> <p>200 loads firing simultaneously at 02:00 because every team wants their data “first thing in the morning” is not a schedule – it’s a thundering herd. It saturates the On-Premises Data Gateway, hammers source systems, and burns Fabric capacity in a spike instead of spreading it across the night.</p> <p>The scheduler is the knob that prevents this. Staggering loads across the night costs nothing and reduces every spike: gateway, source database, and Fabric capacity simultaneously.</p> <div class="language-yaml highlighter-rouge"><div class="highlight"><pre class="highlight"><code><span class="c1"># Before: thundering herd at 02:00</span>
<span class="na">loads</span><span class="pi">:</span>
  <span class="pi">-</span> <span class="na">domain</span><span class="pi">:</span> <span class="s">Sales</span>
    <span class="na">source</span><span class="pi">:</span> <span class="s">Salesforce</span>
    <span class="na">schedule</span><span class="pi">:</span>
      <span class="na">type</span><span class="pi">:</span> <span class="s">daily</span>
      <span class="na">local_time</span><span class="pi">:</span> <span class="s2">"</span><span class="s">02:00"</span>
  <span class="pi">-</span> <span class="na">domain</span><span class="pi">:</span> <span class="s">Marketing</span>
    <span class="na">source</span><span class="pi">:</span> <span class="s">Salesforce</span>
    <span class="na">schedule</span><span class="pi">:</span>
      <span class="na">type</span><span class="pi">:</span> <span class="s">daily</span>
      <span class="na">local_time</span><span class="pi">:</span> <span class="s2">"</span><span class="s">02:00"</span>
  <span class="pi">-</span> <span class="na">domain</span><span class="pi">:</span> <span class="s">Finance</span>
    <span class="na">source</span><span class="pi">:</span> <span class="s">SAP</span>
    <span class="na">schedule</span><span class="pi">:</span>
      <span class="na">type</span><span class="pi">:</span> <span class="s">daily</span>
      <span class="na">local_time</span><span class="pi">:</span> <span class="s2">"</span><span class="s">02:00"</span>

<span class="c1"># After: staggered across the window</span>
<span class="na">loads</span><span class="pi">:</span>
  <span class="pi">-</span> <span class="na">domain</span><span class="pi">:</span> <span class="s">Sales</span>
    <span class="na">source</span><span class="pi">:</span> <span class="s">Salesforce</span>
    <span class="na">schedule</span><span class="pi">:</span>
      <span class="na">type</span><span class="pi">:</span> <span class="s">daily</span>
      <span class="na">local_time</span><span class="pi">:</span> <span class="s2">"</span><span class="s">02:00"</span>
  <span class="pi">-</span> <span class="na">domain</span><span class="pi">:</span> <span class="s">Marketing</span>
    <span class="na">source</span><span class="pi">:</span> <span class="s">Salesforce</span>
    <span class="na">schedule</span><span class="pi">:</span>
      <span class="na">type</span><span class="pi">:</span> <span class="s">daily</span>
      <span class="na">local_time</span><span class="pi">:</span> <span class="s2">"</span><span class="s">02:30"</span>
  <span class="pi">-</span> <span class="na">domain</span><span class="pi">:</span> <span class="s">Finance</span>
    <span class="na">source</span><span class="pi">:</span> <span class="s">SAP</span>
    <span class="na">schedule</span><span class="pi">:</span>
      <span class="na">type</span><span class="pi">:</span> <span class="s">daily</span>
      <span class="na">local_time</span><span class="pi">:</span> <span class="s2">"</span><span class="s">03:00"</span>
</code></pre></div></div> <figure> <picture> <source class="responsive-img-srcset" srcset="/assets/img/yaml-thundering-480.webp 480w,/assets/img/yaml-thundering-800.webp 800w,/assets/img/yaml-thundering-1400.webp 1400w," type="image/webp" sizes="95vw"/> <img src="/assets/img/yaml-thundering.png" class="img-fluid rounded z-depth-1" width="100%" height="auto" data-zoomable="" loading="eager" onerror="this.onerror=null; document.querySelectorAll('.responsive-img-srcset').forEach(function (n) { n.remove(); });"/> </picture> </figure> <div class="caption">Before: every load fires at 02:00 — a thundering herd that saturates the gateway and the source.</div> <figure> <picture> <source class="responsive-img-srcset" srcset="/assets/img/yaml-staggered-480.webp 480w,/assets/img/yaml-staggered-800.webp 800w,/assets/img/yaml-staggered-1400.webp 1400w," type="image/webp" sizes="95vw"/> <img src="/assets/img/yaml-staggered.png" class="img-fluid rounded z-depth-1" width="100%" height="auto" data-zoomable="" loading="eager" onerror="this.onerror=null; document.querySelectorAll('.responsive-img-srcset').forEach(function (n) { n.remove(); });"/> </picture> </figure> <div class="caption">After: the same loads staggered across the window, smoothing the load on shared infrastructure.</div> <p><em>Bar durations are illustrative; the scheduler YAML configures start times only. Actual run duration depends on the source, volume, and gateway throughput.</em></p> <p>No new fields, no platform configuration – a timing change in YAML is all it takes.</p> <p>When performance problems appear in practice, the diagnostic sequence matters. Start with Fabric. If CU is below ~70% of capacity, Fabric is not the bottleneck – looking for a Fabric fix there is looking in the wrong place. If CU sits near or above capacity, options include moving workspaces between capacities or enabling autoscale billing for Spark jobs.</p> <p>If Fabric is clear, move outward to the gateway. In our implementations, On-Premises Gateways start queueing once concurrent connections climb past roughly 5–10 on standard hardware – the exact ceiling depends on the machine and the workloads. Signs of saturation: CPU above 75%, network throughput near its ceiling, or simple latency queries that are slower than they should be. <a href="https://learn.microsoft.com/en-us/data-integration/gateway/service-gateway-performance">Microsoft’s gateway performance guidance</a> covers the tuning levers but doesn’t publish a hard number – the ceiling is what your own load testing reveals.</p> <p>If the gateway is clear, move outward again to the source systems. For relational sources, the question is CPU, disk I/O, memory, and network <em>during the Bronze load window</em>. A source database that handles normal transactional load without issue can still buckle when the Bronze ETL hits it at 3:00 am, especially if it’s on-premises hardware without elastic capacity. Correlating source metrics with load timing is a straightforward investigation: if the source shows CPU spikes that coincide with your ingestion windows, the fix is staggering – moving two simultaneous loads to a 30-minute offset, for example – before it’s adding capacity.</p> <p>The scheduler is the cheapest tool in the stack for load-balancing. A timing change is a YAML commit and a PR. Adding capacity is a budget conversation.</p> <h2 id="the-lock-a-natural-consequence">The lock: a natural consequence</h2> <p>There is one more thing the scheduler creates that Post 4 will deal with directly: <strong>locks</strong>.</p> <p>When the master pipeline triggers a load, it acquires a lock in a control table – a row in a dedicated <code class="language-plaintext highlighter-rouge">control</code> schema that says “this load is currently running.” Post 4 defines the full <code class="language-plaintext highlighter-rouge">control</code> schema in a sidebar (<code class="language-plaintext highlighter-rouge">NotebookLog</code>, <code class="language-plaintext highlighter-rouge">SchedulerLocks</code>, <code class="language-plaintext highlighter-rouge">VolumeCheckQuarantine</code>); for this post we only need to know that the row exists, the orchestrator owns it, and it lives outside the data tables. The lock prevents the next evaluation cycle from firing the same load again before the first run has finished. Two concurrent runs of the same load would produce duplicate data or overwrite each other’s partitions. The lock is not optional.</p> <p>What the lock doesn’t handle is a run that crashes without releasing it. The pipeline fails. The lock stays acquired. The next scheduled run is blocked – and the one after that. A single notebook that fails at 2:00 am – mid-run, without releasing its lock – can freeze an entire domain’s ingestion until someone notices the data hasn’t refreshed at 9:00 am. Seven hours of stale data from one unhandled exception – not because the lock isn’t detectable until then, but because nobody’s watching. That’s a zombie lock. The detection threshold and the manual escape hatch appear in Post 4 as one of four production scars.</p> <p>The scheduler is what makes the tap predictable. A tap that opens at random is not infrastructure – it’s a leak.</p> <h2 id="honest-tradeoffs">Honest tradeoffs</h2> <p>The master pipeline is itself a single point of failure. If the pipeline that evaluates the scheduler YAML crashes or is paused, no loads fire – not one, not two, all of them. Monitor the master pipeline with the same alerting you’d apply to any critical infrastructure component.</p> <p>Timezone management is genuinely annoying. A single timezone declared at the top of the file is the right default. Multi-country implementations where different sources naturally “belong” to different timezones push toward per-load timezone fields. Resist this until you need it – a scheduler file where every entry lives in a different timezone will cost you at 3:00 am.</p> <p>The scheduler declares the contract; it does not enforce it. The orchestrator is fire-and-forget by design: it triggers each load and moves on without waiting for completion. The master pipeline marks itself “complete” when the last load was <em>triggered</em>, not when the last load finished. Detecting when freshness has drifted outside the contract is not the scheduler’s job – it’s the Monitor Pipeline’s, and that’s the next iteration (see below). The current scheduler is the spine that makes enforcement possible: it sets the cadence, declares which loads matter, and writes the logs the Monitor reads.</p> <h2 id="what-the-next-iteration-adds">What the next iteration adds</h2> <p>The scheduler YAML turns timing into a contract – but the contract today is implicit. “Daily at 04:00” means “data no older than ~24 hours plus jitter,” derived from the cadence rather than declared. Operations adjusts the schedule when business renegotiates the freshness expectation, and the schedule’s cadence carries the promise.</p> <p>The next iteration makes the SLO explicit – at the same level as <code class="language-plaintext highlighter-rouge">retry_policy</code>, not per-load:</p> <div class="language-yaml highlighter-rouge"><div class="highlight"><pre class="highlight"><code><span class="na">timezone</span><span class="pi">:</span> <span class="s2">"</span><span class="s">America/Mexico_City"</span>
<span class="na">execution_window</span><span class="pi">:</span>
  <span class="na">interval_minutes</span><span class="pi">:</span> <span class="m">10</span>

<span class="na">retry_policy</span><span class="pi">:</span>
  <span class="na">max_attempts</span><span class="pi">:</span> <span class="m">2</span>
  <span class="na">backoff_minutes</span><span class="pi">:</span> <span class="m">20</span>

<span class="na">freshness_sla</span><span class="pi">:</span>
  <span class="na">max_age_hours</span><span class="pi">:</span> <span class="m">36</span>

<span class="na">loads</span><span class="pi">:</span>
  <span class="pi">-</span> <span class="na">domain</span><span class="pi">:</span> <span class="s">Sales</span>
    <span class="na">source</span><span class="pi">:</span> <span class="s">Salesforce</span>
    <span class="na">schedule</span><span class="pi">:</span>
      <span class="na">type</span><span class="pi">:</span> <span class="s">daily</span>
      <span class="na">local_time</span><span class="pi">:</span> <span class="s2">"</span><span class="s">04:00"</span>
</code></pre></div></div> <p><code class="language-plaintext highlighter-rouge">freshness_sla.max_age_hours</code> is on the roadmap, not wired yet. We describe it here because the discipline of declaring an SLO surfaces a conversation that “daily is fine” was hiding. The schedule and the SLO can move independently – ops can stagger to 03:00 for capacity reasons without changing the promise to downstream. Inconsistency between them (schedule daily, SLO 12h) becomes a pre-deploy validation failure, not tribal knowledge.</p> <p>Why at the file level, not per-load? Same reason <code class="language-plaintext highlighter-rouge">retry_policy</code> lives there: the SLO is a contract the <em>platform</em> makes, not a per-domain negotiation that fragments into thirty different promises. If a domain genuinely needs a different SLO, that’s a signal it belongs in a different platform, not in a different bucket of this one. Uniformity isn’t a restriction here – it’s what keeps the contract legible.</p> <p>This is the iterative and incremental rhythm Scrum names: every sprint of the platform finds a thing the previous version assumed. Post 1 declared <code class="language-plaintext highlighter-rouge">governance.data_owner</code> because anonymous data is a governance failure waiting to happen. Post 4 will add <code class="language-plaintext highlighter-rouge">parquet_date_fix</code> because Spark 3.x exposed corruption we’d been carrying for months. <code class="language-plaintext highlighter-rouge">freshness_sla.max_age_hours</code> is the same pattern – the field forces a conversation that “daily is fine” was avoiding.</p> <p>The SLO field is half of the iteration. The other half is the <strong>Monitor Pipeline</strong> – a separate component that reads execution logs, compares each load’s last successful run against <code class="language-plaintext highlighter-rouge">freshness_sla.max_age_hours</code>, and fires alerts when reality drifts outside the contract. It runs on its own native Fabric schedule, independent of the master pipeline, because it’s the only component that can detect when the master itself has gone down. Without the Monitor, the SLO is a static declaration; with it, the SLO becomes enforceable. The scheduler we built in this post is the spine; the Monitor is what turns “hope is not a schedule” from a slogan into a runtime property.</p> <p>The discipline isn’t “design it perfectly the first time.” It’s “make every iteration surface one more decision the last one left implicit.”</p> <h2 id="whats-next">What’s next</h2> <p><strong>Post 4 – Battle Scars:</strong> The YAML looked perfect in the PR. Then Spark 3.x rejected a date from year 8 – corruption that had been hiding in production for months. A lock outlived its run and blocked an entire domain for seven hours. The YAML in Git turned out not to be the one running in the Lakehouse. Operational lessons from production – and the patterns that contain the damage.</p> <p><strong>Post 5 – Runbooks as Infrastructure:</strong> When the tap breaks. Why the instructions for a human at 3:00 am are engineering, not documentation, and why they live in Git alongside the code they describe.</p> <p><strong>Post 6 – Living Metadata:</strong> We capture metadata with every ingestion. But metadata that nobody reads is dead metadata. How logs become reports, reports become decisions, and three different audiences end up consuming the same underlying data for three different purposes.</p> <hr/> <p>The scheduler is what makes the tap predictable. A tap that opens at random is not infrastructure – it’s a leak.</p> <hr/> <p><em>This is the third post in the series “YAML Metadata-Driven Ingestion.” The patterns described here have evolved across several enterprise Lakehouse implementations and are platform-agnostic, though our reference stack is Microsoft Fabric.</em></p>]]></content><author><name></name></author><category term="yaml-ingestion"/><category term="scheduling"/><category term="orchestration"/><category term="sla"/><category term="data-freshness"/><category term="microsoft-fabric"/><summary type="html"><![CDATA[How scheduling becomes infrastructure -- data freshness as a promise, not a hope]]></summary></entry><entry><title type="html">Metadata All the Way Down</title><link href="https://javierloria.com/blog/2026/metadata-all-the-way-down/" rel="alternate" type="text/html" title="Metadata All the Way Down"/><published>2026-04-18T09:00:00+00:00</published><updated>2026-04-18T09:00:00+00:00</updated><id>https://javierloria.com/blog/2026/metadata-all-the-way-down</id><content type="html" xml:base="https://javierloria.com/blog/2026/metadata-all-the-way-down/"><![CDATA[<p><img src="/assets/img/feat-metadata-all-the-way-down.jpg" alt="Metadata All the Way Down"/></p> <p>A tap isn’t reliable because someone installed it well. It’s reliable because there’s a <strong>building code</strong> that specifies how it must be installed. There’s an inspector who verifies the installation. There’s a certification seal on the fitting. There’s a record – in a filing cabinet somewhere – of who approved the permit and when. Layers of governance verifying other layers of governance. Nobody trusts a single layer. Not in plumbing. Not in metadata.</p> <p>Last post, I said the YAML gets validated against a schema before it runs. Today I open that box.</p> <p>In a metadata-driven system, the metadata itself is an artifact that needs governance. And that governance is provided by… more metadata. It’s metadata all the way down – but not all metadata plays the same role, and confusing the two is how these models stop feeling clean and start feeling like a filing system someone forced on a whiteboard.</p> <p>The YAML from Post 1, however elegant, is worth nothing without the layers that surround it.</p> <h2 id="the-frame-origin-not-use">The frame: origin, not use</h2> <blockquote> <p>“It is best to think of these categories in relation to where Metadata originates, rather than how it is used.” – DMBOK v2, Ch. 12 (Metadata Management), §1.3.2 <em>Types of Metadata</em>, p. 422</p> </blockquote> <p>The easy mistake when modeling metadata is to group it by <strong>use</strong>: “this helps me classify,” “this helps me validate,” “this helps me audit.” Each grouping is tempting because it mirrors how the metadata <em>feels</em> in the moment you consume it. But the groupings cross-cut. A single tag crosses tool boundaries – security scanners, governance dashboards, documentation systems. A single log row ends up in ops dashboards and lineage graphs, and in quality reports that don’t exist yet. Use is a web, not a hierarchy.</p> <p>Origin is a hierarchy. Ask a different question: <em>where was this metadata born?</em></p> <p>In our system, two origins matter:</p> <ul> <li><strong>Configuration metadata</strong> – born from the declarative contract. Lives in Git. Edited by humans. Changed via PR. Governs <em>what and how</em> you ingest. Its cadence is the cadence of engineering decisions: new entity, new source, new classification rule.</li> <li><strong>Operational metadata</strong> – born from execution. Generated as a side effect. Never hand-edited. Records <em>what happened</em> when you ingested. Its cadence is the cadence of the runtime: every run, every entity, every quarantine event.</li> </ul> <p>They look similar from the outside – both are “structured data about data.” But they answer to different masters. Configuration metadata answers to code review. Operational metadata answers to the engine that produced it.</p> <p>This post is about the first origin. The configuration stack has four layers, each with a distinct role. Operational metadata is a different animal with a different story, and I’ll get to it in Post 4.</p> <h2 id="the-four-layers">The four layers</h2> <p>The model, in one table:</p> <table> <thead> <tr> <th>Layer</th> <th>What it is</th> <th>Where it lives</th> <th>Example</th> </tr> </thead> <tbody> <tr> <td><strong>L1</strong> YAML</td> <td>The declarative contract itself</td> <td>Git, <code class="language-plaintext highlighter-rouge">config/</code></td> <td><code class="language-plaintext highlighter-rouge">Sales_Salesforce.yml</code></td> </tr> <tr> <td><strong>L2</strong> Tags</td> <td>Classification metadata embedded inside the YAML</td> <td>Inside the YAML file</td> <td><code class="language-plaintext highlighter-rouge">security.sensitivity: "PII"</code></td> </tr> <tr> <td><strong>L3</strong> Naming convention</td> <td>Metadata that governs the YAML from outside</td> <td>Filename + CI linter</td> <td><code class="language-plaintext highlighter-rouge">{Domain}_{Source}.yml</code></td> </tr> <tr> <td><strong>L4</strong> Yamale</td> <td>The metamodel that validates the YAML’s structure</td> <td><code class="language-plaintext highlighter-rouge">ingestion_schema.yaml</code></td> <td><code class="language-plaintext highlighter-rouge">source_type: enum("relational", "file")</code></td> </tr> </tbody> </table> <p>The ordering is intentional: inside-out from the YAML.</p> <ul> <li><strong>L1</strong> is the artifact. The thing you commit.</li> <li><strong>L2</strong> lives <em>inside</em> the artifact. Tags are embedded in the YAML itself, riding along with every entity.</li> <li><strong>L3</strong> governs the artifact <em>from outside</em>. The filename is metadata the YAML can’t contain – it’s the identity of the file, not its content.</li> <li><strong>L4</strong> is the <em>metamodel</em>. Metadata about the structure of the metadata. One level more abstract than anything below it.</li> </ul> <p>A useful observation: stability increases as you move outward. The YAML’s content changes every time you add an entity. Tags change when governance reclassifies. The naming convention barely ever changes. The Yamale schema changes only when the standard evolves – quarterly, not weekly. This isn’t accidental. The outer layers are the foundations; they’re the parts you <em>don’t</em> want to renegotiate often. The inner layers are the parts that need to evolve with the business.</p> <p>A second observation, less obvious: the layers don’t stack in the direction of “importance.” They stack in the direction of “abstraction.” L1 isn’t more important than L4; it’s more concrete. L4 isn’t more important than L1; it’s more abstract. Each layer does a job the others can’t. Remove any one and the system degrades in a specific, predictable way:</p> <ul> <li>Remove L2 and you have to catalog after the fact.</li> <li>Remove L3 and identity drifts from content.</li> <li>Remove L4 and structural typos slip past review into runtime.</li> <li>Remove L1 and ingestion collapses back to one pipeline per source – the problem the series opened with.</li> </ul> <p>Let’s walk the four layers with the problem each one solves.</p> <h2 id="layer-1-the-yaml-as-contract">Layer 1: The YAML as contract</h2> <p>Post 1 covered L1 in depth. What it didn’t answer is <em>what governs the contract itself</em> – and each of the next three layers resolves a different question L1 alone can’t:</p> <ul> <li>How do we classify the content (PII, ownership, sensitivity)? → <strong>L2 Tags</strong></li> <li>How do we keep the YAML’s identity consistent with its content? → <strong>L3 Naming convention</strong></li> <li>How do we make sure the YAML is well-formed before it runs? → <strong>L4 Yamale</strong> (an open-source YAML schema validator – more on it below)</li> </ul> <h2 id="layer-2--tags-metadata-in-transit">Layer 2 – Tags: metadata-in-transit</h2> <p>Tags travel <em>inside</em> the YAML, but their destination isn’t the ingestion engine – it’s the external governance system.</p> <div class="language-yaml highlighter-rouge"><div class="highlight"><pre class="highlight"><code><span class="na">config</span><span class="pi">:</span>
  <span class="na">tags</span><span class="pi">:</span>
    <span class="na">security.sensitivity</span><span class="pi">:</span> <span class="s2">"</span><span class="s">confidential"</span>
    <span class="na">governance.data_owner</span><span class="pi">:</span> <span class="s2">"</span><span class="s">Sales"</span>

<span class="na">entities</span><span class="pi">:</span>
  <span class="pi">-</span> <span class="na">name</span><span class="pi">:</span> <span class="s">Opportunities</span>
    <span class="na">tags</span><span class="pi">:</span>
      <span class="na">security.sensitivity</span><span class="pi">:</span> <span class="s2">"</span><span class="s">restricted"</span>       <span class="c1"># overrides global tag</span>
      <span class="na">security.classification</span><span class="pi">:</span> <span class="s2">"</span><span class="s">PII"</span>   
</code></pre></div></div> <p>The pattern is inheritance with override. The <code class="language-plaintext highlighter-rouge">config.tags</code> block defines defaults that apply to every entity in the YAML. An individual entity can override a specific tag when it needs to – Opportunities is PII even if the rest of the source is merely confidential. The common case is cheap (one declaration covers everything); the special case is explicit (one line where it matters).</p> <p>Why this matters: classification isn’t a step that happens later. It’s born with the configuration. By the time an entity lands in Bronze, it already carries its governance label. There’s no “we’ll tag it after we profile it” phase – and anyone who’s worked in a large enterprise knows that phase is where classification goes to die.</p> <p>The metaphor: a letter inside an envelope. The YAML is the envelope – edited in Git, copied into the Lakehouse at deploy as a read-only artifact, opened there by the engine at runtime. The tags are the letter inside: once the engine lands the data, the tags ride along with it to the security scanner, the governance dashboard, the compliance report. The envelope stops at the Lakehouse; the letter keeps going.</p> <p>The honest tension: deciding which tags are global and which are per-entity is a conversation with governance, not a code decision. It takes longer than engineering teams expect. Once that conversation converges, the inheritance pattern protects the outcome – but skipping the conversation produces either a YAML where everything is tagged “confidential” (useless) or a YAML where every entity redeclares every tag (brittle).</p> <p><strong>Another traveler: template version.</strong> Not every piece of metadata inside the YAML is a tag. <code class="language-plaintext highlighter-rouge">template_version: "1.0"</code> is a versioning field – also embedded in L1, also metadata-in-transit, but its destination is the engine, not a governance system. When the contract needs to grow – a new section, a new required field – you publish <code class="language-plaintext highlighter-rouge">"2.0"</code> and the engine learns to process both. Existing YAMLs don’t break; new ones adopt the current version. Semantic versioning for your metadata contracts: the same discipline that lets APIs evolve without breaking clients lets your ingestion contract evolve without breaking the YAMLs already in production.</p> <h2 id="layer-3-the-filename-as-a-governance-contract">Layer 3: The filename as a governance contract</h2> <p>Post 1 introduced filename-as-metadata as a design principle. Here it earns its place as a governance layer.</p> <p>The mechanism: <code class="language-plaintext highlighter-rouge">Sales_Salesforce.yml</code> is not a name – it’s a contract. Domain=Sales, source=Salesforce. The Lakehouse schema is <strong>derived</strong> from the filename, never configured manually. The YAML doesn’t duplicate those attributes. It <em>can’t</em> contradict them. The identity of the file and the content of the file are reconciled by construction, not by review.</p> <p>Why this is governance: it eliminates an entire category of inconsistency – the kind where the YAML says one thing, the filename says another, and you only find out when a downstream query returns zero rows. Removing a whole class of bugs by making them unrepresentable is worth more than any amount of validation that catches them after the fact.</p> <p>Patterns observed across projects:</p> <table> <thead> <tr> <th>Pattern</th> <th>Example</th> <th>When it fits</th> </tr> </thead> <tbody> <tr> <td><code class="language-plaintext highlighter-rouge">{Domain}_{Source}</code></td> <td><code class="language-plaintext highlighter-rouge">Sales_Salesforce.yml</code></td> <td>One implementation per source (the common case)</td> </tr> <tr> <td><code class="language-plaintext highlighter-rouge">{Source}_{Domain}</code></td> <td><code class="language-plaintext highlighter-rouge">ERP_Finance.yml</code></td> <td>Orgs where the source is the primary navigational axis</td> </tr> <tr> <td><code class="language-plaintext highlighter-rouge">{Source}_{Country}_{Domain}</code></td> <td><code class="language-plaintext highlighter-rouge">SAP_MX_Accounting.yml</code></td> <td>Multi-country, same source, regional implementations</td> </tr> </tbody> </table> <p>The invariant: domain and source are always explicit. Country is optional and project-specific. The schema name is always <em>derived</em>, never <em>configured</em>. That last rule is what turns a convention into a contract – if you can’t override the schema name in the YAML, the filename wins by construction.</p> <h2 id="layer-4--yamale-the-unit-test-for-your-metadata">Layer 4 – Yamale: the unit test for your metadata</h2> <p>Post 1 said the YAML gets validated against a schema. This is how.</p> <p>The problem it solves: without validation, a typo – <code class="language-plaintext highlighter-rouge">source_tipe: relational</code> instead of <code class="language-plaintext highlighter-rouge">source_type</code> – passes silently and fails at runtime, in production, after the PR is merged and everyone’s moved on. The YAML was “valid” by YAML grammar. It just didn’t mean what the engine expected it to mean.</p> <p>Yamale in one sentence: a declarative schema defining the valid structure of your YAML – types, enums, required fields, optional fields, nested shapes. Written in YAML itself, because the metamodel of the metadata wants to look like the metadata.</p> <div class="language-yaml highlighter-rouge"><div class="highlight"><pre class="highlight"><code><span class="na">config</span><span class="pi">:</span>
  <span class="na">template_version</span><span class="pi">:</span> <span class="s">str(required=True)</span>
  <span class="na">source_type</span><span class="pi">:</span> <span class="s">enum("relational", "file", required=True)</span>
  <span class="na">source_system</span><span class="pi">:</span> <span class="s">map(required=True)</span>
  <span class="na">tags</span><span class="pi">:</span> <span class="s">map(required=False)</span>

<span class="na">entities</span><span class="pi">:</span> <span class="s">list(required=True)</span>
<span class="na">entities.*.name</span><span class="pi">:</span> <span class="s">str(required=True)</span>
<span class="na">entities.*.query</span><span class="pi">:</span> <span class="s">str(required=False)</span>
<span class="na">entities.*.path</span><span class="pi">:</span> <span class="s">str(required=False)</span>
<span class="na">entities.*.tags</span><span class="pi">:</span> <span class="s">map(required=False)</span>
</code></pre></div></div> <p>Where it runs: in the GitOps flow, pre-deploy. If Yamale fails, the YAML never reaches the Lakehouse. It’s a <strong>gate</strong>, not a log. The feedback lands in the PR, while the author is still in context, not in production weeks later when they’ve forgotten the change entirely.</p> <p>Yamale is the unit test for your metadata. If the YAML is the contract between configuration and execution, Yamale is the linter of the contract.</p> <p>The honest limitation: Yamale validates <em>structure</em>, not <em>conditional semantics</em>. It can say “query must be a string.” It can’t say “if source_type is relational, then query is required, but if source_type is file, then path is required.” Rules with an <code class="language-plaintext highlighter-rouge">if</code> in them can’t live in a schema – at least not without turning the schema into a second programming language.</p> <p>The solution: two-layer validation. Yamale validates structure pre-deploy. The notebook validates conditional rules at runtime. Each layer does what it knows how to do, and neither layer pretends to be the other. The trade-off is conscious: Yamale stays simple and declarative; the conditional rules live in the engine where <code class="language-plaintext highlighter-rouge">if</code> statements are cheap.</p> <p>A question worth asking: where do you put the cut between declarative and imperative validation? There’s no universal answer – but there is a principle: <em>if the rule can be expressed without logic, it goes in the schema. If it needs an <code class="language-plaintext highlighter-rouge">if</code>, it goes in code.</em> That line is the one that keeps schemas from rotting into ad hoc DSLs.</p> <h2 id="the-four-layers-in-one-picture">The four layers in one picture</h2> <figure> <picture> <source class="responsive-img-srcset" srcset="/assets/img/yaml-four-layers-480.webp 480w,/assets/img/yaml-four-layers-800.webp 800w,/assets/img/yaml-four-layers-1400.webp 1400w," type="image/webp" sizes="95vw"/> <img src="/assets/img/yaml-four-layers.png" class="img-fluid rounded z-depth-1" width="100%" height="auto" data-zoomable="" loading="eager" onerror="this.onerror=null; document.querySelectorAll('.responsive-img-srcset').forEach(function (n) { n.remove(); });"/> </picture> </figure> <div class="caption">The four layers of metadata governance: the YAML artifact (L1) carries tags and template_version (L2), is named from outside by the filename (L3), and validated pre-deploy by the Yamale metamodel (L4).</div> <p>Four layers, four roles. L2 rides inside L1 as classification payload. L3 names L1 from outside. L4 validates L1’s shape from above. Each one does something the other three can’t.</p> <p><em>Each layer originates somewhere different. That’s what keeps their roles from collapsing into one.</em></p> <h2 id="trust-built-layer-by-layer">Trust built layer by layer</h2> <p>None of these layers were planned on day one. Each emerged from a real problem. The typo that took down an overnight load. The YAML that passed review while an entity was quietly renamed from lowercase to Pascal Case – valid YAML, silent zero rows downstream. The schema that kept pointing to a two-character status field after the source renamed it to three – data flowed, nothing broke, everything was wrong. The tag that existed only in a spreadsheet and was forgotten when the entity went to production. Each bruise was an argument for a layer.</p> <p>Back to the metaphor from Post 1: Bronze should be boring. Now you know what it takes to make it boring <em>reliably</em>. The tap isn’t just functional – you can demonstrate <em>why</em> it works, <em>who</em> approved it, and <em>what happens</em> if something changes. That’s not bureaucracy. That’s what it looks like when trust is an engineered property instead of a social one.</p> <p>“Metadata all the way down” sounds like a philosophical joke. In production, it’s a survival strategy.</p> <h2 id="whats-next">What’s next</h2> <p><strong>Post 3 – The Scheduler’s Contract:</strong> Freshness as a contract. One engine, N entities, one scheduler. How frequency, priority, and dependency are configured – not coded – and why the scheduler creates a new failure mode the engine had to design for: the zombie lock.</p> <p><strong>Post 4 – Battle Scars:</strong> The YAML looked perfect in the PR. Then Spark 3.x rejected a date from year 8 – corruption that had been hiding for months, a pipeline crashed and left a lock that blocked everything for six hours, and the YAML in Git turned out not to be the one running in the Lakehouse. Operational lessons and production scars.</p> <hr/> <p><em>This is the second post in the series “YAML Metadata-Driven Ingestion.” The patterns described here have evolved across several enterprise Lakehouse implementations and are platform-agnostic, though our reference platform is Microsoft Fabric.</em></p>]]></content><author><name></name></author><category term="yaml-ingestion"/><category term="metadata"/><category term="governance"/><category term="validation"/><category term="yaml"/><category term="microsoft-fabric"/><summary type="html"><![CDATA[Governing your ingestion metadata with more metadata -- and knowing which metadata is which]]></summary></entry><entry><title type="html">Bronze Should Be Boring</title><link href="https://javierloria.com/blog/2026/bronze-should-be-boring/" rel="alternate" type="text/html" title="Bronze Should Be Boring"/><published>2026-04-16T09:00:00+00:00</published><updated>2026-04-16T09:00:00+00:00</updated><id>https://javierloria.com/blog/2026/bronze-should-be-boring</id><content type="html" xml:base="https://javierloria.com/blog/2026/bronze-should-be-boring/"><![CDATA[<p><img src="/assets/img/feat-bronze-should-be-boring.jpg" alt="Bronze Should Be Boring"/></p> <p>Open a tap and water comes out. Clean, safe, drinkable. Nobody celebrates. Nobody thinks about it. But behind that unremarkable moment there are treatment plants, distribution networks, pressure monitoring systems, quality tests, and centuries of engineering. The tap is boring because the infrastructure is excellent.</p> <p>Bronze should feel the same way.</p> <p>If adding a new data source to your Lakehouse requires a new pipeline, a round of debugging, a deployment, and a small prayer, you don’t have engineering. You have craft. Artisanal, hand-wired, one-pipeline-per-table craft that works fine at ten entities and becomes a liability at fifty.</p> <p>This post explores how to make Bronze boring, and why that requires more engineering than you’d expect. It’s the first in a series where we walk through the metadata-driven architecture that makes this simplicity possible. We start with the foundation: the Bronze layer and why YAML is the contract that holds it together.</p> <h2 id="the-problem-pipeline-proliferation">The problem: pipeline proliferation</h2> <p>Here’s a story you’ve probably lived. You start a Lakehouse project with ten entities and two sources. You build a pipeline per entity and an orchestrator pipeline on top. It works. It’s “agile.”</p> <p>A year later you have five sources, three countries, and 350 entities. You also have 350 pipelines. Each one with its own connection logic, its own error handling, its own technical columns (or not), and its own naming invented by whoever built it that day. Some have retry logic. Some don’t. Some log to a control table. Some log to nowhere.</p> <p>The problem is not the volume of data. It’s the volume of <em>pipelines</em>. Each one is code you need to maintain, test, document, and debug. Each one is a surface area for bugs. Each one is a deployment. And every new entity becomes a 2-3 day development ticket where it should be a 15-minute commit – because someone has to clone an existing pipeline, change fifteen things, forget to change two others, and debug in production until it works. Until it doesn’t, and nobody remembers why it was built that way.</p> <p>There’s another way. And it starts by rethinking what Bronze actually is.</p> <h2 id="bronze-redefined-not-just-raw-copy">Bronze redefined: not just “raw copy”</h2> <p>The classic Medallion definition is clean and tidy. Bronze is raw copy – data as it arrives, no transformations. Silver cleans. Gold aggregates. It’s a useful mental model with one practical problem: if Bronze is just a dump, the data enters without identity.</p> <p>You don’t know where it came from. You don’t know who sent it. You don’t know if it’s complete. You don’t know when it arrived. And more importantly, you don’t know who owns it. If you wait until Silver to answer those questions, you’ve already let someone into your building without asking for ID, and now you’re trying to figure out who they are after the fact.</p> <p>Our redefinition: Bronze is a copy with full fidelity to the source, <em>enriched</em> with metadata and governance from the point of entry.</p> <table> <thead> <tr> <th>Classic Bronze (“raw copy”)</th> <th>Enriched Bronze</th> </tr> </thead> <tbody> <tr> <td>Data as-is</td> <td>Data + technical columns (RunID, LoadDateUTC, BatchID, SnapshotDate)</td> </tr> <tr> <td>Generic schema (staging, raw)</td> <td>Schema that reflects source and domain in the name</td> </tr> <tr> <td>No classification</td> <td>Security and governance tags from ingestion</td> </tr> <tr> <td>Pass or fail</td> <td>Anomalies go to quarantine, they don’t break the load</td> </tr> <tr> <td>Unknown schema</td> <td>Schema capture and drift detection from day one</td> </tr> </tbody> </table> <p>“But that’s not Bronze anymore – that’s Silver.” No. The original data is not modified or cleaned. What gets added is <em>metadata</em>: technical columns, classification, schema naming. The data maintains its fidelity to the source. It’s raw data plus rich metadata.</p> <p>OK, enriched Bronze sounds good. But how do you implement it without ending up with 200 artisanal pipelines? That’s where YAML comes in.</p> <h2 id="the-solution-a-fixed-engine-plus-n-yamls">The solution: a fixed engine plus N YAMLs</h2> <p>The architecture in one sentence:</p> <blockquote> <p>A small, fixed engine of specialized components + N YAML files = N sources ingested without writing new code.</p> </blockquote> <p>The key insight: it’s not one magic notebook that does everything. It’s a <strong>finite set of generic components</strong>, each specialized in a single concern:</p> <ul> <li><strong>Ingestion by source type</strong> – Different components for different origins. Files (CSV, Parquet, Excel): a notebook that reads, applies schema, writes Delta. Relational databases: a pipeline with ForEach and parameterized Copy Activity. APIs: a notebook with a request-paginate-land pattern.</li> <li><strong>Schema capture</strong> – A notebook that records the data dictionary (table structure) with every ingestion. When the structure drifts from the last known version – new column, type change, field removed – the drift is logged to a registry so it can be reviewed before it surprises a downstream consumer.</li> <li><strong>Volume validation</strong> – A notebook that compares rows received vs. expected and flags anomalies. Rows that fail integrity rules don’t break the load; they’re routed to a quarantine table tagged with the reason, while the rest proceed. Quarantine is a side channel, not a failure.</li> <li><strong>Orchestration</strong> – A master pipeline that reads the YAMLs and triggers the appropriate components. Bronze has no cross-table dependencies by design: every entity lands independently. Dependency resolution is a Silver problem, not a Bronze one. Bronze takes data as-is – duplicates, nulls, and invalid foreign keys all land intact. That’s the contract. Referential integrity requires knowing that a referenced table loaded before its referencing one, and that ordering logic belongs in Silver.</li> </ul> <p>The number of engine components is <strong>small and bounded</strong> – five, seven, maybe ten in complex environments. It doesn’t grow with data volume or source count. What scales is the <em>configuration</em>: adding source number 201 doesn’t require a new component, just a new YAML the existing components already know how to read. New concerns like PII detection, freshness checks, or sample preview slot in as new notebooks wired to the same contract – not as new pipelines per source.</p> <h3 id="why-yaml-and-not-json-a-ui-or-sql-metadata-tables">Why YAML (and not JSON, a UI, or SQL metadata tables)</h3> <p>This isn’t an article about YAML syntax. It’s about the <em>properties</em> you need in your configuration format. Three axes:</p> <p><strong>1. Governability – Configuration lives in Git, not in a database</strong></p> <p>YAML in Git inherits all the code-review machinery you already use: PRs, diffs, blame, rollback, approval gates as strict as governance requires. “Who edited row 47 in <code class="language-plaintext highlighter-rouge">dbo.PipelineConfig</code> on Tuesday at 3am?” is a hard question. “Who edited <code class="language-plaintext highlighter-rouge">Sales_Salesforce.yml</code>?” is <code class="language-plaintext highlighter-rouge">git blame</code>.</p> <p>This is not a new pattern. It’s Infrastructure as Code – declarative configuration, version control, automated deployment, repeatability – applied to ingestion instead of infrastructure. The same fundamentals that made server provisioning predictable with Terraform make data-source provisioning predictable here. How it plugs into DevOps practice (pre-deploy validation, approval pipelines, rollback) is the topic of the next post.</p> <p><strong>2. Extensibility – The contract evolves without breaking</strong></p> <p>Adding a new section to a YAML doesn’t break existing YAMLs that don’t use it. <code class="language-plaintext highlighter-rouge">template_version: "1.0"</code> evolves to <code class="language-plaintext highlighter-rouge">"2.0"</code>, and the engine knows which version to process. Adding a column to a config table, by contrast, means ALTER TABLE, a deployment, and coordinating with everything that reads it. One is a commit; the other is a project.</p> <p><strong>3. Usability – Human readable, machine readable, AI readable</strong></p> <p>A new data engineer opens the YAML and understands what it does without documentation – no SQL knowledge required, no database access, no UI to learn. Copy an existing one, change five lines, submit a PR. And an argument nobody was making two years ago: YAML is structured plain text, the ideal format for an LLM to read, generate, and modify. Ask a model to produce an <code class="language-plaintext highlighter-rouge">INSERT INTO</code> with 15 nullable columns versus a YAML following a template – the difference in reliability is dramatic. We didn’t design this with AI agents in mind, but the structure accommodates them naturally: an agent can read existing YAMLs, review Git history to understand which changes correlated with incidents, and propose a new entity – committing the file and opening a PR on request. The contract is already machine-readable.</p> <p><strong>The alternatives, briefly:</strong></p> <ul> <li><strong>JSON</strong> – Modern tooling (JSON5, schema-aware editors) narrows the gap, but long configs still drown in quotes and brackets, and diffing nested JSON is an eye test.</li> <li><strong>UI (web portals)</strong> – Not versionable, not diffable, not scriptable. Config trapped in the platform.</li> <li><strong>SQL metadata tables</strong> – Excellent for <em>operational</em> metadata (logs, status, metrics) – but for declarative configuration they mix concerns: the same place where you write config is where the runtime executes.</li> </ul> <h3 id="core-design-principles">Core design principles</h3> <p>Four principles that drive everything downstream:</p> <ol> <li><strong>GitOps as source of truth</strong> – YAML is edited only in Git. Every change via PR. The Lakehouse contains deployed artifacts, not editable ones.</li> <li><strong>Filename-as-metadata</strong> – The filename <em>is</em> metadata. <code class="language-plaintext highlighter-rouge">Sales_Salesforce.yml</code> means domain=Sales, source=Salesforce, and the Lakehouse schema is derived from the name. This is the riskiest bet in the design – and the one that pays the most; see the deep-dive below.</li> <li><strong>One YAML per source-domain</strong> – Clear granularity. Not a mega-YAML with everything, not one YAML per individual table.</li> <li><strong>Pure declarativity</strong> – The YAML never contains logic. Only parameters. “The YAML describes <em>what</em> gets ingested; the engine decides <em>how</em>.”</li> </ol> <h3 id="what-a-yaml-looks-like">What a YAML looks like</h3> <p>Here’s what a real ingestion YAML looks like, trimmed to the essentials:</p> <div class="language-yaml highlighter-rouge"><div class="highlight"><pre class="highlight"><code><span class="c1"># File: Sales_Salesforce.yml</span>
<span class="c1"># Implicit metadata from filename: domain=Sales, source=Salesforce</span>
<span class="c1"># Automatic destination schema: Sales_Salesforce</span>

<span class="na">config</span><span class="pi">:</span>
  <span class="na">template_version</span><span class="pi">:</span> <span class="s2">"</span><span class="s">1.0"</span>
  <span class="na">source_type</span><span class="pi">:</span> <span class="s">relational</span>
  <span class="na">source_system</span><span class="pi">:</span>
    <span class="na">owner</span><span class="pi">:</span> <span class="s2">"</span><span class="s">Revenue-Ops"</span>
  <span class="na">tags</span><span class="pi">:</span>
    <span class="na">security.sensitivity</span><span class="pi">:</span> <span class="s2">"</span><span class="s">confidential"</span>
    <span class="na">governance.data_owner</span><span class="pi">:</span> <span class="s2">"</span><span class="s">Sales"</span>

<span class="na">entities</span><span class="pi">:</span>
  <span class="pi">-</span> <span class="na">name</span><span class="pi">:</span> <span class="s">Opportunities</span>
    <span class="na">table</span><span class="pi">:</span> <span class="s">Salesforce.Opportunity</span>
    <span class="na">tags</span><span class="pi">:</span>
      <span class="na">security.sensitivity</span><span class="pi">:</span> <span class="s2">"</span><span class="s">restricted"</span>       <span class="c1"># overrides global tag</span>
      <span class="na">security.classification</span><span class="pi">:</span> <span class="s2">"</span><span class="s">PII"</span>   
    <span class="na">post_ingestion_tasks</span><span class="pi">:</span>
      <span class="na">volume_check</span><span class="pi">:</span>
        <span class="na">enabled</span><span class="pi">:</span> <span class="kc">true</span>
        <span class="na">min_rows</span><span class="pi">:</span> <span class="m">500</span>
      <span class="na">schema_capture</span><span class="pi">:</span>
        <span class="na">enabled</span><span class="pi">:</span> <span class="kc">true</span>

  <span class="pi">-</span> <span class="na">name</span><span class="pi">:</span> <span class="s">Products</span>
    <span class="na">table</span><span class="pi">:</span> <span class="s">Salesforce.Product</span>
    <span class="na">tags</span><span class="pi">:</span>
      <span class="na">security.sensitivity</span><span class="pi">:</span> <span class="s2">"</span><span class="s">internal"</span>
    <span class="na">post_ingestion_tasks</span><span class="pi">:</span>
      <span class="na">volume_check</span><span class="pi">:</span>
        <span class="na">enabled</span><span class="pi">:</span> <span class="kc">false</span>
      <span class="na">schema_capture</span><span class="pi">:</span>
        <span class="na">enabled</span><span class="pi">:</span> <span class="kc">true</span>
</code></pre></div></div> <p>Everything you need to know about these two entities fits on a screen. The domain, the source, the governance owner, the security classification, the volume thresholds, the schema capture flag – all declared, no code. Adding a third entity is five more lines and a pull request.</p> <p>Entity-level tags override global ones – <code class="language-plaintext highlighter-rouge">Opportunities</code> inherits <code class="language-plaintext highlighter-rouge">confidential</code> from the file header, then <code class="language-plaintext highlighter-rouge">restricted</code> takes precedence. The narrower the scope wins. Security classifications can be tightened at the entity level without touching the global default.</p> <p>This YAML gets validated against a schema before it runs. That’s the topic of the next post.</p> <h3 id="filename-as-metadata-the-bet-that-pays">Filename-as-metadata: the bet that pays</h3> <p><code class="language-plaintext highlighter-rouge">Sales_Salesforce.yml</code> looks like a naming convention. It’s a governance contract.</p> <p>The natural instinct when registering a new source is to name it by origin: <code class="language-plaintext highlighter-rouge">Salesforce.yml</code>, <code class="language-plaintext highlighter-rouge">SAP.yml</code>, <code class="language-plaintext highlighter-rouge">Oracle.yml</code>. The source is unambiguous. Assigning a domain is not. Someone has to decide whether Salesforce data belongs to Sales, Revenue, or Customer Success, and those are different teams with different interests. That’s exactly why we require it.</p> <p>The filename forces a political question up front: who owns this data? Not later, not in a spreadsheet, not “we’ll figure it out in Silver.” Before the YAML can merge, someone has answered. The alternative – letting data land anonymously in Bronze and arguing about ownership six months later, when a dashboard is wrong and no one knows who to escalate to – is the default in most organizations, and it’s also what erodes trust in the Lakehouse faster than any technical failure.</p> <p>Requiring a domain gives you three things that source-only naming never could:</p> <ul> <li><strong>An owner and a steward, mandatory and named.</strong> Every domain maps to a Product Owner and a Steward – real people, not “IT.” When an ingestion breaches its SLA, there’s someone to notify. When a column’s definition is disputed, there’s someone to arbitrate. Accountability is encoded in the architecture, not relegated to a wiki page that nobody maintains.</li> <li><strong>Schema-level security.</strong> The domain becomes the Lakehouse schema: <code class="language-plaintext highlighter-rouge">Sales_Salesforce</code>, <code class="language-plaintext highlighter-rouge">Finance_SAP</code>, <code class="language-plaintext highlighter-rouge">HR_Workday</code>. That’s not cosmetic. Access can be granted to the <code class="language-plaintext highlighter-rouge">Sales</code> schema as a unit, and the whole domain is governed by the same ACL regardless of how many sources feed it. Try doing that when your schema is called <code class="language-plaintext highlighter-rouge">raw</code> or <code class="language-plaintext highlighter-rouge">staging</code>.</li> <li><strong>Natural clustering of entities that belong together.</strong> Sales entities – Opportunities, Products, Accounts – share release calendars, business definitions, and consumption patterns. Grouping them by domain reflects the reality that they make sense together, and that ingesting them out of sync creates inconsistencies the business will feel downstream.</li> </ul> <p>The risk is real. A typo in the filename, a renamed domain mid-project, a name that doesn’t exist in the business glossary: any of these breaks the contract. The mitigation is boring: a CI check validates every new filename against an allow-list of approved domains and sources before the PR can merge. One linter, a few lines of code. The convention stops being a convention and becomes an enforceable contract.</p> <p>Bronze stops being IT’s problem. That’s the bet that pays.</p> <h2 id="the-result-the-tap-works">The result: the tap works</h2> <p>Numbers from representative implementations – order of magnitude, not SLAs:</p> <ul> <li><strong>Adding a new entity</strong> – typically under 15 minutes for a standard relational table; more for an API with pagination quirks or a file with a messy schema. YAML only, no code.</li> <li><strong>Configuration rollback</strong> – under 10 minutes. Revert the PR, redeploy the YAML.</li> <li><strong>100% of configuration versioned in Git.</strong> This one isn’t approximate: every change has an author, a reviewer, and a timestamp, because there’s no other way to change config.</li> </ul> <p>Two targets the architecture is designed for, and has to keep earning:</p> <p><strong>Junior-engineer ergonomics.</strong> Someone new to the project should be able to add a source by copying an existing YAML, changing what’s different, and opening a PR – without reading notebook code or touching PySpark. When that stops being true, the engine is leaking complexity back into the configuration.</p> <p><strong>3am legibility.</strong> When a load fails at 3am, the on-call engineer should open the YAML for the failing entity and understand what was supposed to happen, without digging into pipeline code. The configuration <em>is</em> the documentation.</p> <p>When someone asks what your Bronze layer does, the best answer is: “nothing interesting.” Boring Bronze isn’t the goal; it’s the consequence of engineering that’s actually done. The excitement should live in what you build <em>on top</em>: Silver, Gold, semantic models, dashboards. Bronze is the invisible infrastructure that makes all of that possible.</p> <h2 id="honest-tradeoffs">Honest tradeoffs</h2> <p><strong>Secrets and credentials – out of scope by design.</strong> The YAML never carries secrets. No hardcoded connection strings, no tokens, no API keys. If a source needs authentication, the YAML points to a Key Vault entry; the engine resolves it at runtime through a service principal. The moment a secret lands in Git, your audit trail becomes a liability instead of an asset. Ingestion config in Git, secrets in Key Vault – two systems, zero overlap.</p> <p><strong>The engine is a single point of failure.</strong> Two hundred artisanal pipelines fail independently; a shared engine with a bug affects all two hundred sources at once. The mitigation surface is also shared (one fix heals all two hundred), but the blast radius is not symmetric – invest in the engine’s test coverage accordingly. A secondary effect: Fabric’s per-pipeline logs become less useful when every entity runs under the same orchestrator object. You need your own control tables. That’s Post 4.</p> <h2 id="whats-next">What’s next</h2> <p>But making something boring requires solving problems that are not boring at all.</p> <p><strong>Next: Metadata All the Way Down</strong> – Who validates the YAML? Who validates the validator? In a metadata-driven system, the metadata itself needs governance. It’s metadata all the way down.</p> <p><strong>The Scheduler’s Contract</strong> – The engine runs. But when? And what guarantees that the data is fresh enough for downstream consumers? Latency as a contract, not a hope.</p> <p><strong>Battle Scars</strong> – The YAML looked perfect in the PR. Then Spark 3.x rejected dates from 1753. Operational lessons and scars from production.</p> <p><strong>Runbooks as Infrastructure</strong> – Every scar has a fix. That fix becomes a runbook: versioned, auditable, deployable on demand.</p> <p><strong>Living Metadata</strong> – We capture metadata with every ingestion. But metadata that nobody reads is dead metadata. How to turn it into decisions.</p> <hr/> <p><em>First post in the “YAML Metadata-Driven Ingestion” series. These patterns come from several enterprise Lakehouse implementations – platform-agnostic, though our reference stack is Microsoft Fabric.</em></p>]]></content><author><name></name></author><category term="yaml-ingestion"/><category term="bronze"/><category term="ingestion"/><category term="yaml"/><category term="medallion"/><category term="microsoft-fabric"/><summary type="html"><![CDATA[Designing a metadata-driven ingestion layer that disappears behind a YAML commit]]></summary></entry></feed>