The Scheduler's Contract
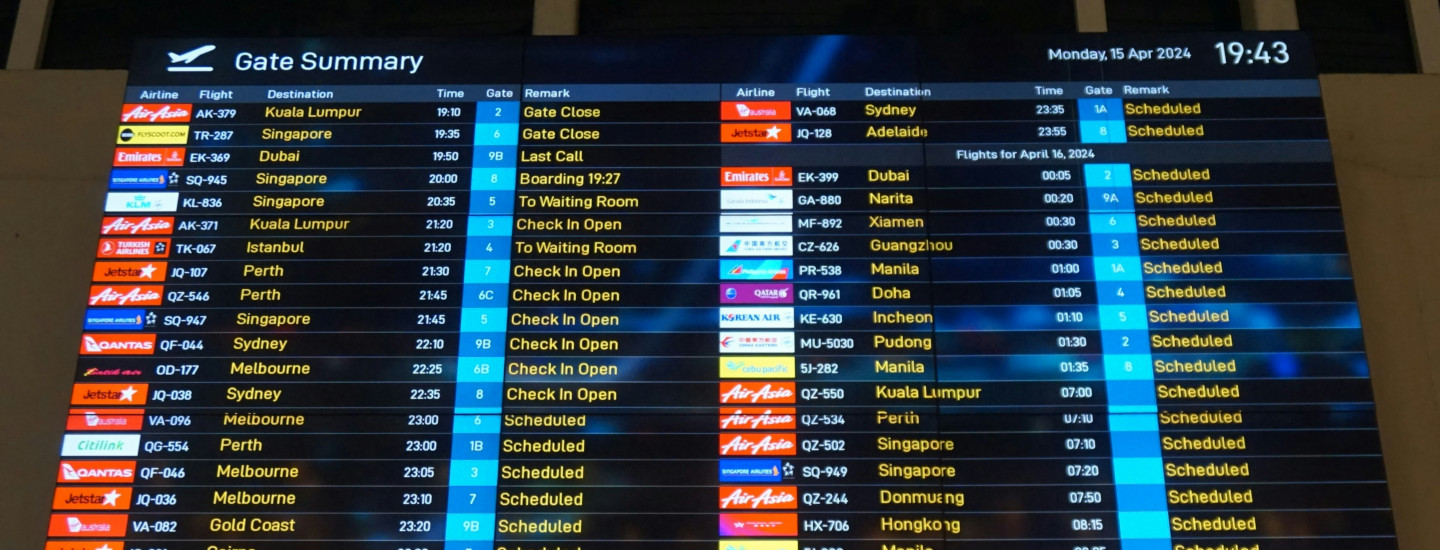
Open a tap. Water comes out – boring, reliable, the way Post 1 described it. But Post 1 left a question open: how old is the water?
A tap that opens at the wrong time, or not at all, delivers stale data. An analyst who pulls Sales_Opportunities at 9:00 am and gets data from two days ago doesn’t have a pipeline problem. They have a freshness problem. A table called Sales_Opportunities is not a static artifact – it’s a snapshot of a moment that’s already passed. Every query is an answer to an implicit question: how old is this data? Can you promise – to an analyst, to a downstream pipeline, to a business process that depends on it – that the data is no more than four hours old? Or six? Do you know, or do you just hope?
Hope is not a schedule.
This post is about the component of a metadata-driven Bronze layer that nobody talks about until something breaks at 3:00 am: the scheduler. Not because it’s complex – it isn’t. It matters because it’s the part that turns data freshness from a property you discover after the fact into a freshness window you commit to in advance – not an exact timestamp, but a bounded promise.
That “bounded” matters more than it sounds. The Lakehouse model is BASE – Basically Available, Soft state, Eventually consistent – not ACID. Bronze is expected to converge to source truth over time, not to reflect it at the instant a transaction commits. The scheduler’s contract is the operational expression of that consistency model: not when the data is exact, but how stale it’s allowed to be.
The constraint that forces the design
Start with a simple reality. Native pipeline schedules in Microsoft Fabric work fine for a handful of pipelines on common cadences – attach a schedule, set the time, done. The limit appears when scheduling stops being just when and starts being which-given-state: “run Sales Salesforce on Tuesday at 04:00 unless Finance SAP is paused for migration, and stagger Marketing 30 minutes later because the gateway saturates otherwise.”
Conditional logic across loads doesn’t belong in a scheduling UI. It belongs in a file – versionable, diffable, reviewable in a PR. Native schedules can tell a pipeline when to run; they can’t read the YAML that declares which loads are due, which are paused, which carry an offset, and which have to wait for a dependency to release a lock. That logic has to live somewhere outside the platform’s scheduling UI.
There’s a secondary scaling issue worth naming. Fabric limits each pipeline to 20 attached schedules, a documented platform constraint. For a Lakehouse with 350+ loads across multiple sources, domains, and countries, that ceiling matters – but it’s not the reason native scheduling doesn’t fit. Even with no limit at all, you’d still need the YAML to carry the conditional logic. The 20-schedule cap is the symptom, not the cause.
In a real Lakehouse – multiple sources, multiple domains, multiple countries – you have 350+ loads. You are not building 350 individual scheduled pipelines. That path leads to the same proliferation problem Post 1 opened with: 200 pipelines, each with its own schedule hardcoded in a portal, none of them visible in Git, none of them diffable, none of them auditable. You can’t answer “what changed and when?” and you can’t answer “what runs at 4:00 am and why?” without clicking through every pipeline manually.
The metadata-driven solution is the same pattern applied here: one master pipeline that evaluates every few minutes which loads are due, and a single YAML file that declares the schedule for all of them. The complexity moves from the platform into a file where it belongs: versionable, reviewable, and writable in a text editor.
Two contracts, two files
The most important design decision in this post: the scheduler YAML is never the same file as the ingestion YAML.
Post 1 introduced the ingestion YAML: Sales_Salesforce.yml, which declares what to ingest and how. The scheduler YAML – call it _scheduler.yml – declares when. They are two separate files because they answer two different questions, evolve at two different rates, and belong to two different audiences.
The ingestion YAML changes when the data model changes: a new entity, a schema update, a new security tag. It’s a data engineering artifact.
The scheduler YAML changes when the operational contract changes: a source goes offline, a load needs to run more frequently, a new business process requires intraday data. It’s an operational artifact. Ops teams with no interest in schema details still have opinions about timing windows and retry policies. In one of our implementations, Ops blocked the merge of a new Salesforce load because it was scheduled at 02:30 – the same gateway was already saturated with Marketing at that hour. The PR review surfaced a conversation that wouldn’t have happened if schedule and ingestion lived in the same file: we shifted the load to 03:15 and the merge went through.
Mixing both concerns into a single file creates a merge conflict waiting to happen. Two separate files means two separate PRs, two separate reviewers, two separate cadences. The contract that governs what data is ingested stays decoupled from the contract that governs when.
The same field name – enabled – means different things in each file: a business decision in the ingestion YAML (Data Owner sets it), an operational one in the scheduler (Ops sets it). The operational effect is the same – the load doesn’t run – but the owner and the approval chain differ.
The two files carry different RACI assignments:
| Dimension | Ingestion YAML | Scheduler YAML |
|---|---|---|
| Declares | What to ingest, how to classify | When to run, retry policy |
| Responsible | Data Owner | Operations |
| Informed | Operations | Business |
| Changes when | Data model changes | Operational contract changes |
Anatomy of the scheduler YAML
Here is what a complete scheduler YAML looks like with English keys:
# File: _scheduler.yml
# Controls WHEN each load runs -- separate from WHAT and HOW

timezone: "America/Mexico_City"
execution_window:
  interval_minutes: 10          # Master pipeline polls every 10 min

retry_policy:
  max_attempts: 2
  backoff_minutes: 20

loads:
  - domain: Sales
    source: Salesforce
    enabled: true
    schedule:
      type: weekly
      day_of_week: "Tuesday"
      local_time: "04:00"

  - domain: Finance
    source: SAP
    enabled: false
    disable_reason: "SAP S/4 migration in progress -- re-enable after cutover"
    schedule:
      type: daily
      local_time: "02:00"

  - domain: Operations
    source: ERP
    enabled: true
    schedule:
      type: intraday
      interval_hours: 4
      window_start: "06:00"
      window_end: "22:00"

  - domain: Finance
    source: Close
    enabled: true
    schedule:
      type: monthly
      day_of_month: 1
      local_time: "03:00"
      business_day: true   # if the 1st falls on weekend, run the next business day

  - domain: Marketing
    source: WebAnalytics
    enabled: true
    schedule:
      type: cron
      expression: "0 3 * * 1-5"   # escape hatch: weekdays only at 03:00
Walk the sections:
timezone – All times in the file are local. The master pipeline converts to UTC internally. Every team that reads this file should be able to reason about “04:00” without doing mental timezone math. Use a single timezone for the whole file.
execution_window.interval_minutes – The master pipeline runs on a native Fabric schedule, every 10 minutes in this case. It wakes up, reads this YAML, evaluates which loads are due based on their schedule and last run time, and triggers them. The interval is the precision floor of your freshness guarantees: if a load is due at 06:00 and the pipeline runs at 05:58 and 06:08, it fires at 06:08. That 8-minute jitter is acceptable for daily loads. It matters more for intraday ones, which we’ll return to.
retry_policy – Two retry attempts, 20-minute backoff. Defined once, applies to all loads. The policy is centralized because retry behavior is a cross-cutting concern – the next section explains why it must live here and not in the individual notebooks.
loads – Each entry maps to one ingestion YAML: domain and source together form the lookup key. The orchestrator derives the filename as {Domain}_{Source}.yml – the same convention established in Post 1. No configuration table, no mapping file. The filename is the contract. The enabled/disable_reason pair is worth its own section below.
Five schedule types cover the operational patterns we keep running into: weekly, daily, and intraday for steady cadences; monthly with a business_day flag for financial close and similar end-of-period loads (if the 1st of the month falls on a weekend, the load runs the next business day); and cron as an escape hatch for anything irregular – weekdays-only loads, quarter-end reports, the long tail of “we need this twice a year.” First-class types stay first-class because most production loads fall into them; cron exists so the YAML doesn’t grow a new top-level type every time Operations encounters something exotic.
Retry belongs here, not in the notebook
A notebook can retry. You can wrap the ingestion loop in a try/except, catch transient errors, sleep, and re-attempt. Many teams do this.
The problem: when each notebook manages its own retry, the behavior is inconsistent. Different notebooks have different retry counts, different backoff durations, different error categories they consider retryable. One has 3 attempts with 10-minute backoff. Another has 5 attempts with no backoff. A third has no retry at all. When something fails at 3:00 am, you’re not looking at one retry policy – you’re looking at whatever the person who wrote that notebook decided on that day.
The scheduler centralizes the policy. One declaration governs all loads. If the policy changes – business decides 3 attempts is the new standard, or a source becomes flaky and needs extended backoff – you edit one YAML and one PR. Not fifty notebooks.
The deeper principle: retry is not specific to a data source. It’s a cross-cutting concern about system reliability. Reliability concerns belong in the orchestration layer, not scattered across individual execution units. This is the same argument Infrastructure as Code makes about server provisioning – configuration that applies everywhere should live in one place, not be repeated with variations in every deployment manifest.
Why retry is uniform, not per-load. A reader might ask: what if one source is genuinely flaky and another isn’t? Shouldn’t we override retry on just the flaky one? No – and the reason is the one Post 1 used to defend {Domain}_{Source}.yml as a contract. The domain is the unit of operational consistency. Entities in the same YAML load together, fail together, retry together – they belong to the same operational baseline by design.
This is a deliberate constraint, not a missing feature. Per-load retry overrides would turn the scheduler YAML from “this is how the platform retries” into “this is how each domain retries independently” – a contract becomes a collection. If a developer wants different retry for one domain, they have to create a new platform deployment, which implicitly creates a new operational boundary. That conversation – “is this really part of this platform, or is it something else?” – is exactly the conversation the architecture is supposed to surface.
Enabled/DisableReason: audit trail, not just a toggle
The Finance SAP entry above has enabled: false. Without context, that’s noise.
With disable_reason: "SAP S/4 migration in progress -- re-enable after cutover", it’s institutional memory – and the orchestrator propagates it. The entry isn’t removed from the registry; on every evaluation cycle, the master pipeline writes a skip event to the NotebookLog (Post 4’s control schema sidebar) carrying the same disable_reason string the YAML declares. The reason starts in the YAML and lands in every log entry the load skips. Six months from now, a new engineer opens the logs at 2:00 am because someone complained Finance data hasn’t updated since February. The answer is already there – in the YAML, and in every skip event between February and now. Nobody has to remember. Nobody has to dig through Slack history or ask the person who made the decision.
This matters more because of who owns this file. Operations sets enabled: false – but Business is the Informed party. They depend on the data being available; when it isn’t, they need an explanation that doesn’t require a Slack thread, a ticket, or an escalation. disable_reason is that explanation, embedded in the contract itself. The engineer at 3:00 am can read it. So can the analyst who expected fresh data at 8:00 am.
The rule: enabled: false without disable_reason should fail your pre-merge validation. Post 2 split validation into two layers: Yamale for structural checks (declarative), the engine for conditional rules at runtime. This rule has an if in it – “if enabled is false, disable_reason is required” – so it doesn’t fit in the Yamale schema. But it also shouldn’t wait for runtime: a disabled load with no reason is a contract bug, and contract bugs belong pre-deploy. A small Python validator runs alongside Yamale in the same pre-deploy step – same code-not-schema principle as Post 2, just a different home. If you’re deliberately halting a production load, you owe the next engineer – and the 3:00 am version of yourself – an explanation. The reason isn’t optional. It’s part of the contract.
What belongs in a disable reason: enough context to make a decision without escalating. “Disabled for testing” fails that bar. “SAP S/4 migration in progress – re-enable after cutover, coordinate with finance@” passes it.
Intraday loads: when the scheduler becomes critical infrastructure
Daily loads are convenient. Intraday loads are where the scheduler stops being optional.
Most Bronze loads in a typical Lakehouse run once a day or once a week. The scheduler is useful there, but the stakes are low – a missed trigger means stale data for hours, which is recoverable. Now add a load that runs every four hours. Or every 15 minutes.
  - domain: Inventory
    source: WMS
    enabled: true
    schedule:
      type: intraday
      interval_hours: 4
      window_start: "06:00"
      window_end: "22:00"
At interval_hours: 4 with a 6:00 am–10:00 pm window, this load fires at 06:00, 10:00, 14:00, 18:00, and 22:00 – five times daily. Each run must complete, log its result, and release its lock before the next is due. The system tolerates a 10-minute jitter when data is expected once a week. It does not tolerate it when a warehouse replenishment process expects a snapshot every four hours.
The scheduler’s interval_minutes (the master pipeline poll cadence) now matters. At 10 minutes, a due load fires within 10 minutes of its target time. Whether that’s acceptable depends on the downstream SLO. Ten minutes is the practical floor for batch – go lower and you’ve stopped doing batch.
What is not a scheduler problem: loads where the run duration starts to approach the schedule interval. That line typically falls between 5 and 15 minutes, and it depends on three things – how long the load itself takes, how much jitter the downstream tolerates, and the evaluate-and-trigger overhead of the master pipeline. Once you cross it, you’re not in batch territory anymore: you’re paying batch overhead to chase a real-time problem. That belongs in streaming infrastructure – in Fabric, Eventstream.
The scheduler as a load-balancing lever
The scheduler answers “when” – but “when” is not purely a business question. It’s also an infrastructure question.
200 loads firing simultaneously at 02:00 because every team wants their data “first thing in the morning” is not a schedule – it’s a thundering herd. It saturates the On-Premises Data Gateway, hammers source systems, and burns Fabric capacity in a spike instead of spreading it across the night.
The scheduler is the knob that prevents this. Staggering loads across the night costs nothing and reduces every spike: gateway, source database, and Fabric capacity simultaneously.
# Before: thundering herd at 02:00
loads:
  - domain: Sales
    source: Salesforce
    schedule:
      type: daily
      local_time: "02:00"
  - domain: Marketing
    source: Salesforce
    schedule:
      type: daily
      local_time: "02:00"
  - domain: Finance
    source: SAP
    schedule:
      type: daily
      local_time: "02:00"

# After: staggered across the window
loads:
  - domain: Sales
    source: Salesforce
    schedule:
      type: daily
      local_time: "02:00"
  - domain: Marketing
    source: Salesforce
    schedule:
      type: daily
      local_time: "02:30"
  - domain: Finance
    source: SAP
    schedule:
      type: daily
      local_time: "03:00"


Bar durations are illustrative; the scheduler YAML configures start times only. Actual run duration depends on the source, volume, and gateway throughput.
No new fields, no platform configuration – a timing change in YAML is all it takes.
When performance problems appear in practice, the diagnostic sequence matters. Start with Fabric. If CU is below ~70% of capacity, Fabric is not the bottleneck – looking for a Fabric fix there is looking in the wrong place. If CU sits near or above capacity, options include moving workspaces between capacities or enabling autoscale billing for Spark jobs.
If Fabric is clear, move outward to the gateway. In our implementations, On-Premises Gateways start queueing once concurrent connections climb past roughly 5–10 on standard hardware – the exact ceiling depends on the machine and the workloads. Signs of saturation: CPU above 75%, network throughput near its ceiling, or simple latency queries that are slower than they should be. Microsoft’s gateway performance guidance covers the tuning levers but doesn’t publish a hard number – the ceiling is what your own load testing reveals.
If the gateway is clear, move outward again to the source systems. For relational sources, the question is CPU, disk I/O, memory, and network during the Bronze load window. A source database that handles normal transactional load without issue can still buckle when the Bronze ETL hits it at 3:00 am, especially if it’s on-premises hardware without elastic capacity. Correlating source metrics with load timing is a straightforward investigation: if the source shows CPU spikes that coincide with your ingestion windows, the fix is staggering – moving two simultaneous loads to a 30-minute offset, for example – before it’s adding capacity.
The scheduler is the cheapest tool in the stack for load-balancing. A timing change is a YAML commit and a PR. Adding capacity is a budget conversation.
The lock: a natural consequence
There is one more thing the scheduler creates that Post 4 will deal with directly: locks.
When the master pipeline triggers a load, it acquires a lock in a control table – a row in a dedicated control schema that says “this load is currently running.” Post 4 defines the full control schema in a sidebar (NotebookLog, SchedulerLocks, VolumeCheckQuarantine); for this post we only need to know that the row exists, the orchestrator owns it, and it lives outside the data tables. The lock prevents the next evaluation cycle from firing the same load again before the first run has finished. Two concurrent runs of the same load would produce duplicate data or overwrite each other’s partitions. The lock is not optional.
What the lock doesn’t handle is a run that crashes without releasing it. The pipeline fails. The lock stays acquired. The next scheduled run is blocked – and the one after that. A single notebook that fails at 2:00 am – mid-run, without releasing its lock – can freeze an entire domain’s ingestion until someone notices the data hasn’t refreshed at 9:00 am. Seven hours of stale data from one unhandled exception – not because the lock isn’t detectable until then, but because nobody’s watching. That’s a zombie lock. The detection threshold and the manual escape hatch appear in Post 4 as one of four production scars.
The scheduler is what makes the tap predictable. A tap that opens at random is not infrastructure – it’s a leak.
Honest tradeoffs
The master pipeline is itself a single point of failure. If the pipeline that evaluates the scheduler YAML crashes or is paused, no loads fire – not one, not two, all of them. Monitor the master pipeline with the same alerting you’d apply to any critical infrastructure component.
Timezone management is genuinely annoying. A single timezone declared at the top of the file is the right default. Multi-country implementations where different sources naturally “belong” to different timezones push toward per-load timezone fields. Resist this until you need it – a scheduler file where every entry lives in a different timezone will cost you at 3:00 am.
The scheduler declares the contract; it does not enforce it. The orchestrator is fire-and-forget by design: it triggers each load and moves on without waiting for completion. The master pipeline marks itself “complete” when the last load was triggered, not when the last load finished. Detecting when freshness has drifted outside the contract is not the scheduler’s job – it’s the Monitor Pipeline’s, and that’s the next iteration (see below). The current scheduler is the spine that makes enforcement possible: it sets the cadence, declares which loads matter, and writes the logs the Monitor reads.
What the next iteration adds
The scheduler YAML turns timing into a contract – but the contract today is implicit. “Daily at 04:00” means “data no older than ~24 hours plus jitter,” derived from the cadence rather than declared. Operations adjusts the schedule when business renegotiates the freshness expectation, and the schedule’s cadence carries the promise.
The next iteration makes the SLO explicit – at the same level as retry_policy, not per-load:
timezone: "America/Mexico_City"
execution_window:
  interval_minutes: 10

retry_policy:
  max_attempts: 2
  backoff_minutes: 20

freshness_sla:
  max_age_hours: 36

loads:
  - domain: Sales
    source: Salesforce
    schedule:
      type: daily
      local_time: "04:00"
freshness_sla.max_age_hours is on the roadmap, not wired yet. We describe it here because the discipline of declaring an SLO surfaces a conversation that “daily is fine” was hiding. The schedule and the SLO can move independently – ops can stagger to 03:00 for capacity reasons without changing the promise to downstream. Inconsistency between them (schedule daily, SLO 12h) becomes a pre-deploy validation failure, not tribal knowledge.
Why at the file level, not per-load? Same reason retry_policy lives there: the SLO is a contract the platform makes, not a per-domain negotiation that fragments into thirty different promises. If a domain genuinely needs a different SLO, that’s a signal it belongs in a different platform, not in a different bucket of this one. Uniformity isn’t a restriction here – it’s what keeps the contract legible.
This is the iterative and incremental rhythm Scrum names: every sprint of the platform finds a thing the previous version assumed. Post 1 declared governance.data_owner because anonymous data is a governance failure waiting to happen. Post 4 will add parquet_date_fix because Spark 3.x exposed corruption we’d been carrying for months. freshness_sla.max_age_hours is the same pattern – the field forces a conversation that “daily is fine” was avoiding.
The SLO field is half of the iteration. The other half is the Monitor Pipeline – a separate component that reads execution logs, compares each load’s last successful run against freshness_sla.max_age_hours, and fires alerts when reality drifts outside the contract. It runs on its own native Fabric schedule, independent of the master pipeline, because it’s the only component that can detect when the master itself has gone down. Without the Monitor, the SLO is a static declaration; with it, the SLO becomes enforceable. The scheduler we built in this post is the spine; the Monitor is what turns “hope is not a schedule” from a slogan into a runtime property.
The discipline isn’t “design it perfectly the first time.” It’s “make every iteration surface one more decision the last one left implicit.”
What’s next
Post 4 – Battle Scars: The YAML looked perfect in the PR. Then Spark 3.x rejected a date from year 8 – corruption that had been hiding in production for months. A lock outlived its run and blocked an entire domain for seven hours. The YAML in Git turned out not to be the one running in the Lakehouse. Operational lessons from production – and the patterns that contain the damage.
Post 5 – Runbooks as Infrastructure: When the tap breaks. Why the instructions for a human at 3:00 am are engineering, not documentation, and why they live in Git alongside the code they describe.
Post 6 – Living Metadata: We capture metadata with every ingestion. But metadata that nobody reads is dead metadata. How logs become reports, reports become decisions, and three different audiences end up consuming the same underlying data for three different purposes.
The scheduler is what makes the tap predictable. A tap that opens at random is not infrastructure – it’s a leak.
This is the third post in the series “YAML Metadata-Driven Ingestion.” The patterns described here have evolved across several enterprise Lakehouse implementations and are platform-agnostic, though our reference stack is Microsoft Fabric.
Enjoy Reading This Article?
Here are some more articles you might like to read next: