We Act on Metadata

Open a tap and water comes out. Six posts in, that’s still the right frame. If you’re just arriving, start at Post 1 – this is the end of the series. If you’ve made it this far: here’s what the infrastructure was quietly generating the whole time.
“We kill people based on metadata”
In April 2014, former NSA and CIA director Michael Hayden spoke at a Johns Hopkins symposium in the middle of the post-Snowden congressional debate. The NSA had been collecting metadata from telecom companies – call records, not call content. Who called whom, when, for how long, from what location, from what device. No conversations recorded. No content intercepted.
“We kill people based on metadata,” Hayden said.
The quote is jarring; that’s the point. Hayden wasn’t defending targeting policy – he was acknowledging what the system had become. Metadata was no longer the byproduct of intelligence work; it was the product. His own point: “metadata absolutely tells you everything about somebody’s life.” A pattern of calls – who you reach at what hour, from which location, how long those calls last – is sufficient to make targeting decisions without listening to a single word.
Now consider the average enterprise data team.
They have metadata. PII classifications in a catalog. Schema documentation. Data owner fields in a spreadsheet. Execution logs in a database nobody queries. They captured it – often at significant cost, a sprint or more. But the metadata exists and produces nothing. No decision depends on it. No process reads it automatically. It’s a compliance tax paid at launch, with no return on the investment after that.
The NSA didn’t just collect metadata. They acted on it – continuously, systematically, as the primary output of a system designed for that purpose. The point isn’t the surveillance – it’s the decision-readiness. Hayden’s system connects metadata to targeting decisions by design. Most enterprise catalogs don’t connect metadata to any decision at all. The question isn’t whether to capture metadata. It’s whether your system acts on it – or leaves it as evidence of governance without the substance of it.
In a system designed the way we’ve described, acting on metadata is not a second project. It’s the natural output of a platform that was always generating it. The runbooks, post-ingestion notebooks, and YAML feedback loops in Posts 4-5 already act on it where the loops are wired. The reports come next.
This post connects the wires that are still loose.
Dead metadata is the norm
The pattern every practitioner has lived.
A team spends a sprint in the data catalog. Adding descriptions, assigning owners, validating PII classifications, drawing lineage. On launch day the catalog is 95% accurate and beautifully organized.
Week three: a new source was onboarded. The catalog entry was queued but not created yet – this week’s sprint was all incidents. The schema for Sales_Salesforce.Opportunities had a column removed upstream. The catalog still lists it. The assigned data owner moved to a different business unit. Nobody updated the field.
Month six: the governance team runs an audit. Sixty percent of catalog entries haven’t been touched since launch. Nobody can say which ones are accurate and which ones are stale. The catalog is now a liability – it gives the appearance of governance without the substance of it.
Three forms of dead metadata, one failure mode:
| Form | When it was accurate | When it stops being true |
|---|---|---|
| Data dictionary in Confluence | Launch day | Next sprint |
| Lineage diagram in a slide deck | The day it was drawn | First schema change |
| Data owner in a spreadsheet | When they assigned it | When the org chart changed |
The failure is structural, not behavioral. Metadata became a document someone had to maintain, competing with everything else on the backlog. When it lost that competition – and it always does – it quietly stopped being true while still looking official.
Gartner mapped this in their 2022 Market Guide for Active Metadata Management (G00756612, De Simoni & Beyer): five maturity levels, from Level 0 (Unaware) to Level 5 (Augmented). Most enterprise data teams sit at Level 1 or Level 2 – scheduled updates, coordinated descriptors, technically accurate at launch.
The catalog was accurate on launch day.
Level 3 – what Gartner calls Preactive – is where metadata starts working for you: schema drift detection, critical asset resolution, trend analysis. The platform described in this series generates those capabilities as a side-effect of execution, not as a separate project. Level 4 adds ML over profiling and automated recommendations – out of scope here, but not out of reach once you have the foundation.
Active versus passive, in the Gartner maturity sense, isn’t a tool choice. It’s a design consequence. A Level 2 catalog was built to be maintained by humans; it loses to the backlog every time. A Level 3 system generates metadata continuously from execution; nobody has to remember to update it.
This system already generates live metadata
Here’s the twist. If you built what Posts 1-5 described, your platform has been generating metadata with every single run. You haven’t built a catalog – you’ve been generating one.
DMBOK v2 describes operational metadata (Ch.12, §1.3.2.3) as “details of the processing and accessing of data” – logs of job execution, history of extracts, audit results. Every table in this platform matches that definition exactly:
| Table | What it captures | Frequency |
|---|---|---|
control.PipelineLog | Run status, domain, start/end, error, tags | Every pipeline execution |
control.ActivityLog | Per-entity activity, YAML path, YAML version, row counts | Every entity load |
control.VolumeCheckQuarantine | Volume anomalies, thresholds, resolution status | Every volume check |
control.SchedulerLocks | Lock state, acquire/release timestamps, reasons | Every scheduler cycle |
catalog.Columns | Schema per entity, PII classification, capture timestamp | Every schema capture run |
catalog.Entities | Entity registry: domain, source, country, config file | Every deployment |
catalog.ConfigFiles | Config audit: git commit hash, deployed_at | Every YAML deploy |
The key distinction from Post 2: these are operational metadata – generated by execution, per DMBOK’s definition above. One design rule the platform adds on top: these tables are never hand-edited. Post 2 handled configuration metadata: born from the contract, lives in Git. Different origin, same principle. The YAML is configuration; everything these tables capture is operational.
In most Lakehouses, catalog and ingestion are separate teams, separate tools, separate cadences. In this platform, catalog.Columns is updated with every ingestion run. The catalog is not a project. It’s a side-effect.
From logs to decisions: the Gold layer
Operations engineers query the control tables directly – the runbooks in Post 5 carry those queries for exactly that purpose. For everyone else – DQ stewards, governance committees, business stakeholders – raw execution logs are the wrong starting point. Decisions need a semantic model.
The translation layer is a star schema in the Gold warehouse that converts logs into metrics, metrics into KPIs, KPIs into decisions. A note on the term: when Medallion talks about “Gold,” it usually means business aggregations – Sales, Finance, ARR. Here, Gold is the operational counterpart: same Medallion discipline, different domain. Two Gold layers sit side by side in the Warehouse: one for the business, one for the platform that runs it.
The schema has three dimensions (Countries, Dates, Entities) and two facts: Findings for quality anomalies and quarantine events, and QualityMetrics for completeness, uniqueness, and validity scores. One hard constraint: zero PII in Gold. The Gold layer contains only aggregated metrics – never the underlying row data. catalog.Columns may reference which columns are PII-tagged, but the values themselves never leave Bronze.
The transformation chain:
Raw log → Metric → KPI → Decision

PipelineLog rows      →  % success rate        →  SLA compliance    →  Escalate / Accept
VolumeCheckQuarantine →  Anomalies this week    →  Quality score     →  Adjust thresholds
catalog.Columns      →  Drift events by entity →  Schema stability  →  Prioritize review
catalog.Entities     →  Coverage by domain     →  Governance score  →  Report to committee
The architecture is deliberately boring. Stored Procedures in the Fabric Warehouse read from the Lakehouse tables and load incrementally into the star schema. Direct Lake means the semantic model never needs a scheduled refresh – Power BI reads the Warehouse’s underlying Delta tables directly from OneLake, without round-trips through SQL. In Fabric, the Warehouse sees the Lakehouse as a database – a three-part name [Lakehouse].[Schema].[Table] is all it takes to query across the boundary:
-- Incremental load from the metadata Lakehouse into the Gold star schema
SELECT RunID, Domain, StartTime, EndTime, Status, RowCount
FROM   Lh_Metadata.control.PipelineLog
WHERE  LoadDateUTC > @last_loaded
That’s the pattern for every fact table. No Kafka. No EventHub. No dedicated observability platform. A Stored Procedure and a delta parameter. And every row carries its own lineage – RunID, BatchID, SnapshotDate – without a separate lineage tool.
A concrete example end-to-end: Sales_Salesforce.Opportunities gains a new column CloseDate_Adjusted in the source. A post-ingestion notebook, an optional but recommended task that fires after each pipeline run, queries the ingested table, compares its current schema against the last recorded state in catalog.Columns, and writes any new or removed columns as drift events. Schema capture is declared alongside the other post-ingestion tasks in the entity’s YAML:
post_ingestion_tasks:
  volume_check:
    enabled: true
    min_rows: 1000
    max_rows: 5000000
  schema_capture:
    enabled: true
It detects CloseDate_Adjusted and records it. Gold surfaces: “3 schema drift events this week in the Sales domain.” The DQ steward opens a review: is this intentional? Does the column need a PII tag? YAML is updated via PR. Next run: catalog.Columns reflects the classification; governance dashboard shows 100% coverage restored.
One event. One review. Zero manual catalog updates.
Three audiences, one source
The same tables serve three audiences asking very different questions. Most platforms build one of these – the ops dashboard – and call it done. All three matter, and all three are addressable from the same source.
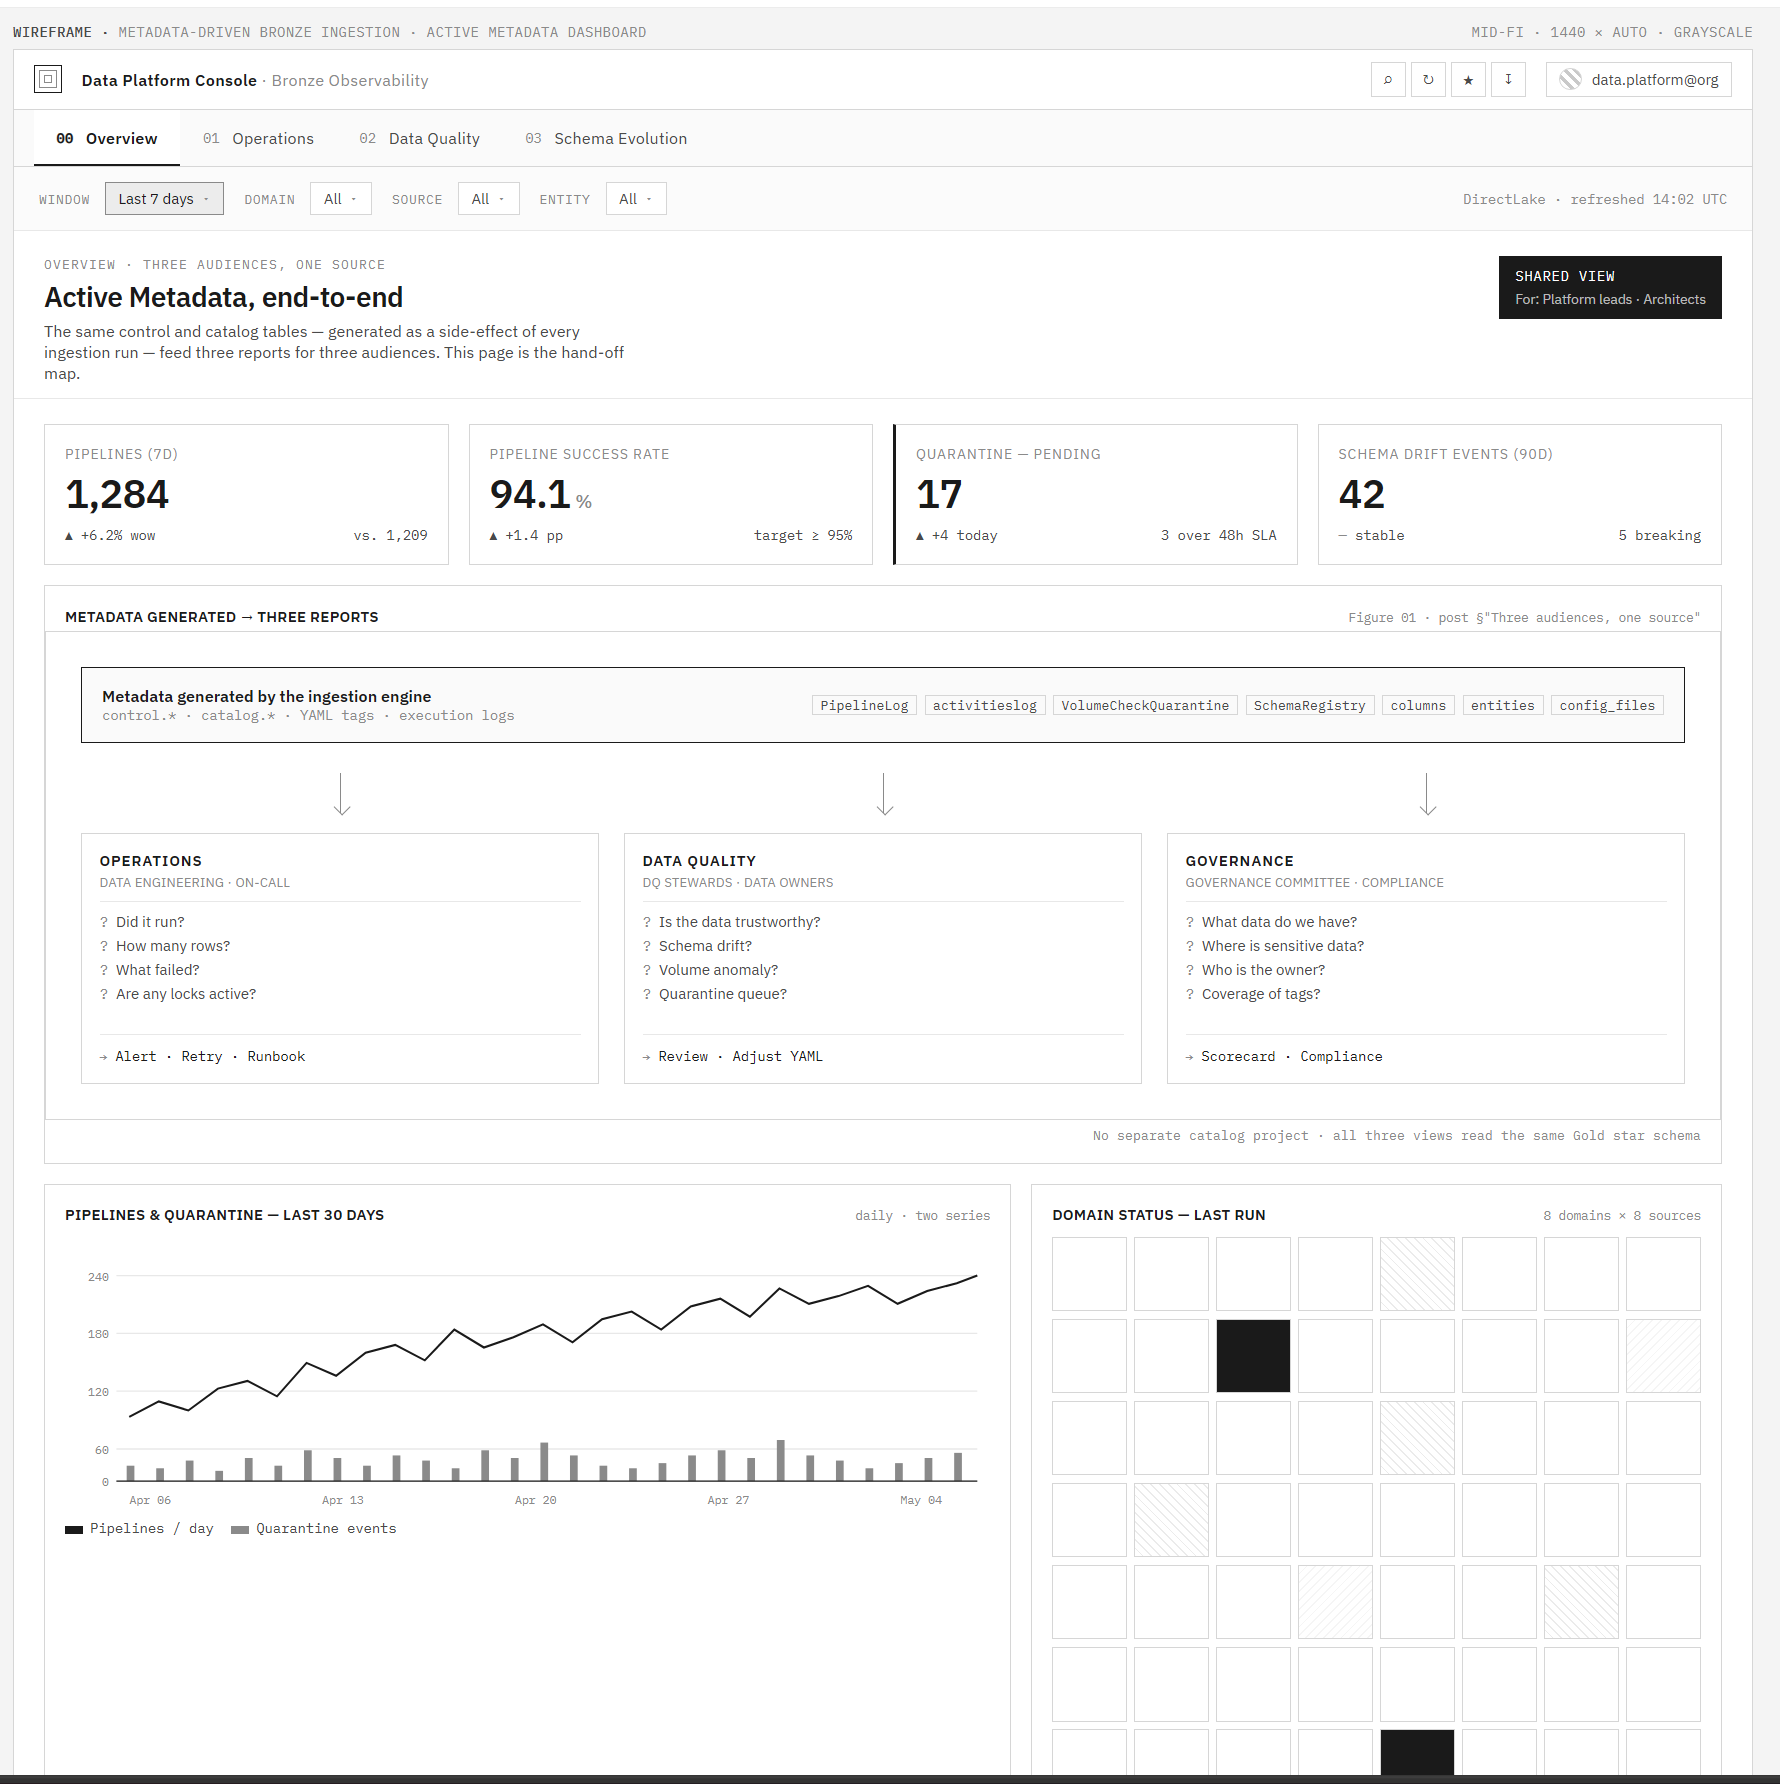 Mockup – Data Platform Console, Bronze Observability (in development). The Overview tab surfaces KPIs and routes to three audience-specific views: Operations, Data Quality, and Schema Evolution.
Operations – primary sources: control.PipelineLog, control.ActivityLog, control.SchedulerLocks. The questions: did it run? How many rows? What failed? Locks active? The decision layer: Teams alerts, runbook triggers, retry decisions. The ops team doesn’t need to open a YAML file to know whether last night’s loads completed.
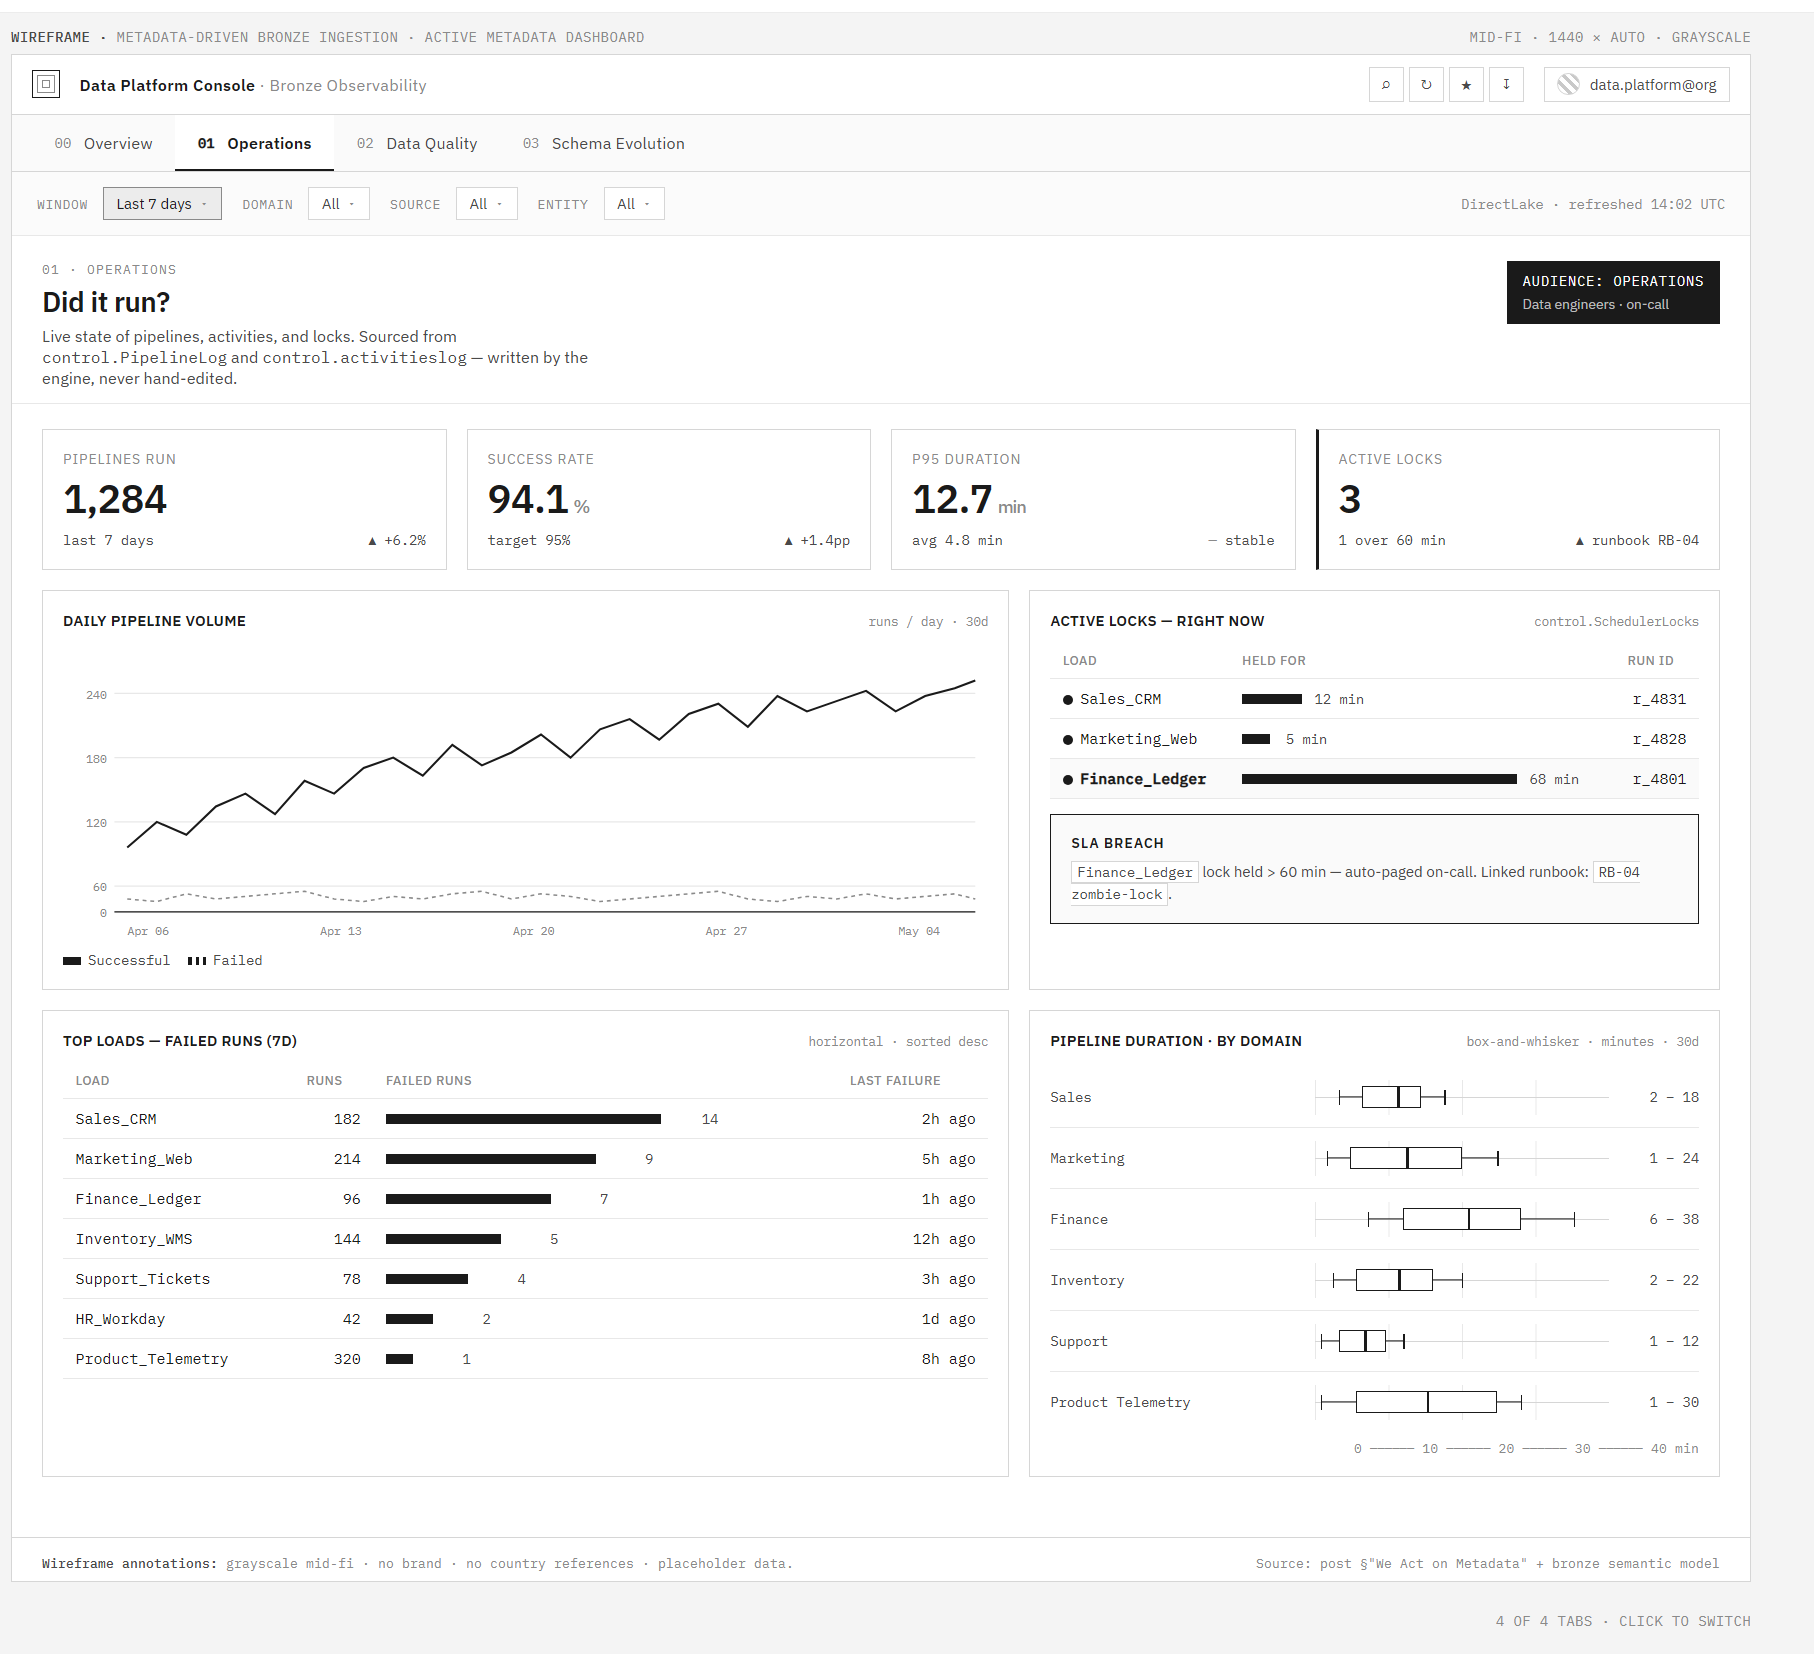 Mockup – Operations view (in development): pipeline volume, active locks, SLA breach detection, and top failed runs, once built, sourced from
 control.PipelineLog and control.ActivityLog.
Data Quality – primary sources: control.VolumeCheckQuarantine, catalog.Columns. The questions: is the data trustworthy? Is there schema drift? Is the quarantine backlog growing? Schema drift detected in catalog.Columns is the early signal, before anyone reports “the numbers look off.”
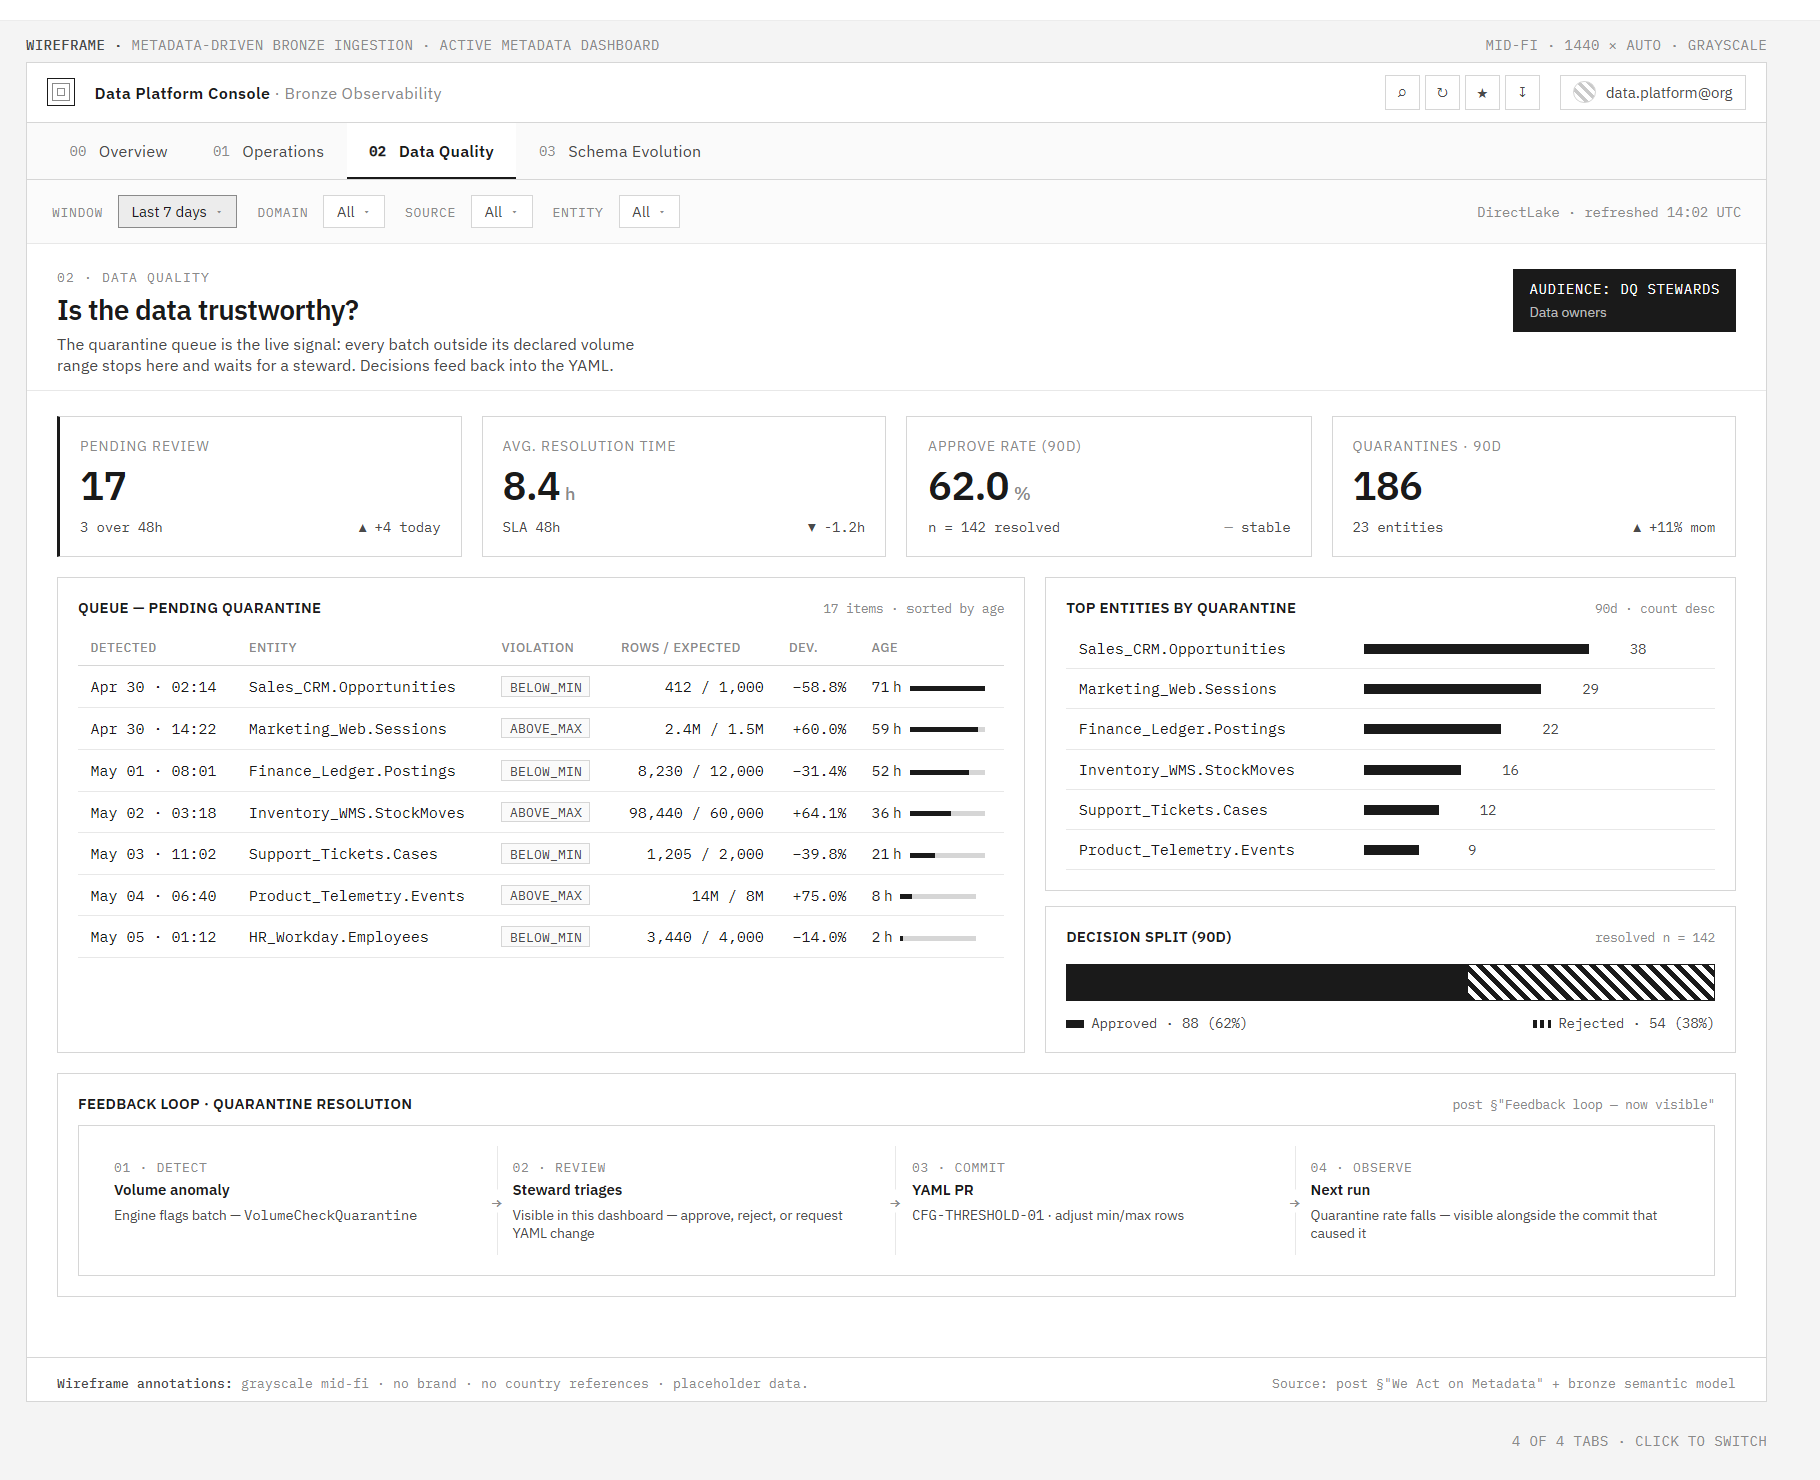 Mockup – Data Quality view (in development): quarantine queue with volume vs. expected ranges, resolution workflow, and the feedback loop made visible, from volume anomaly to YAML threshold adjustment.
Governance – primary sources: catalog.Entities, catalog.Columns (pii_classification), catalog.ConfigFiles, plus the Git history of the YAML files themselves – a complete audit trail of every configuration decision, surfaced through catalog.YamlChanges once its ETL is wired (see below). The questions: what data do we have? Where is PII? Who owns it? Are all columns classified? The governance committee doesn’t open Power BI – but the governance analyst who briefs them does. The dashboard replaces a manually assembled quarterly report with a live view over data the system generates continuously.
The YAML tags from Post 2 – security.sensitivity, governance.data_owner – are live here. Updated via Git PR, not a manual catalog UI. The change management lens is already complete: every YAML file carries its full Git history – a tamper-evident record of every configuration decision ever made, who proposed it, who approved it, when it landed, what changed. Post 1’s GitOps discipline has been generating this trail since day one. What’s pending is the wiring: one ETL script (git log --follow config/*.yml) materializes it as catalog.YamlChanges, queryable alongside the operational data. Until then, the same questions are answerable – they just require git log and a steward’s time instead of a SQL join. The questions either path resolves:
- “Who changed the PII classification for Opportunities, and when?” – independently of whether the load ran that day
- “Were there any YAML changes in the week before this quarantine spike?” – correlating config decisions with operational outcomes (one query after the ETL lands; a
git logplus manual cross-reference until then) - “Which YAMLs haven’t been touched in 12 months?” – stale config detection: a source with no recent commits and declining row counts deserves a review
- “How many new sources were onboarded this quarter?” – growth velocity and team workload, counted from
change_type = 'created'
The Git audit trail is already a governance asset. The ETL just makes it a queryable one.
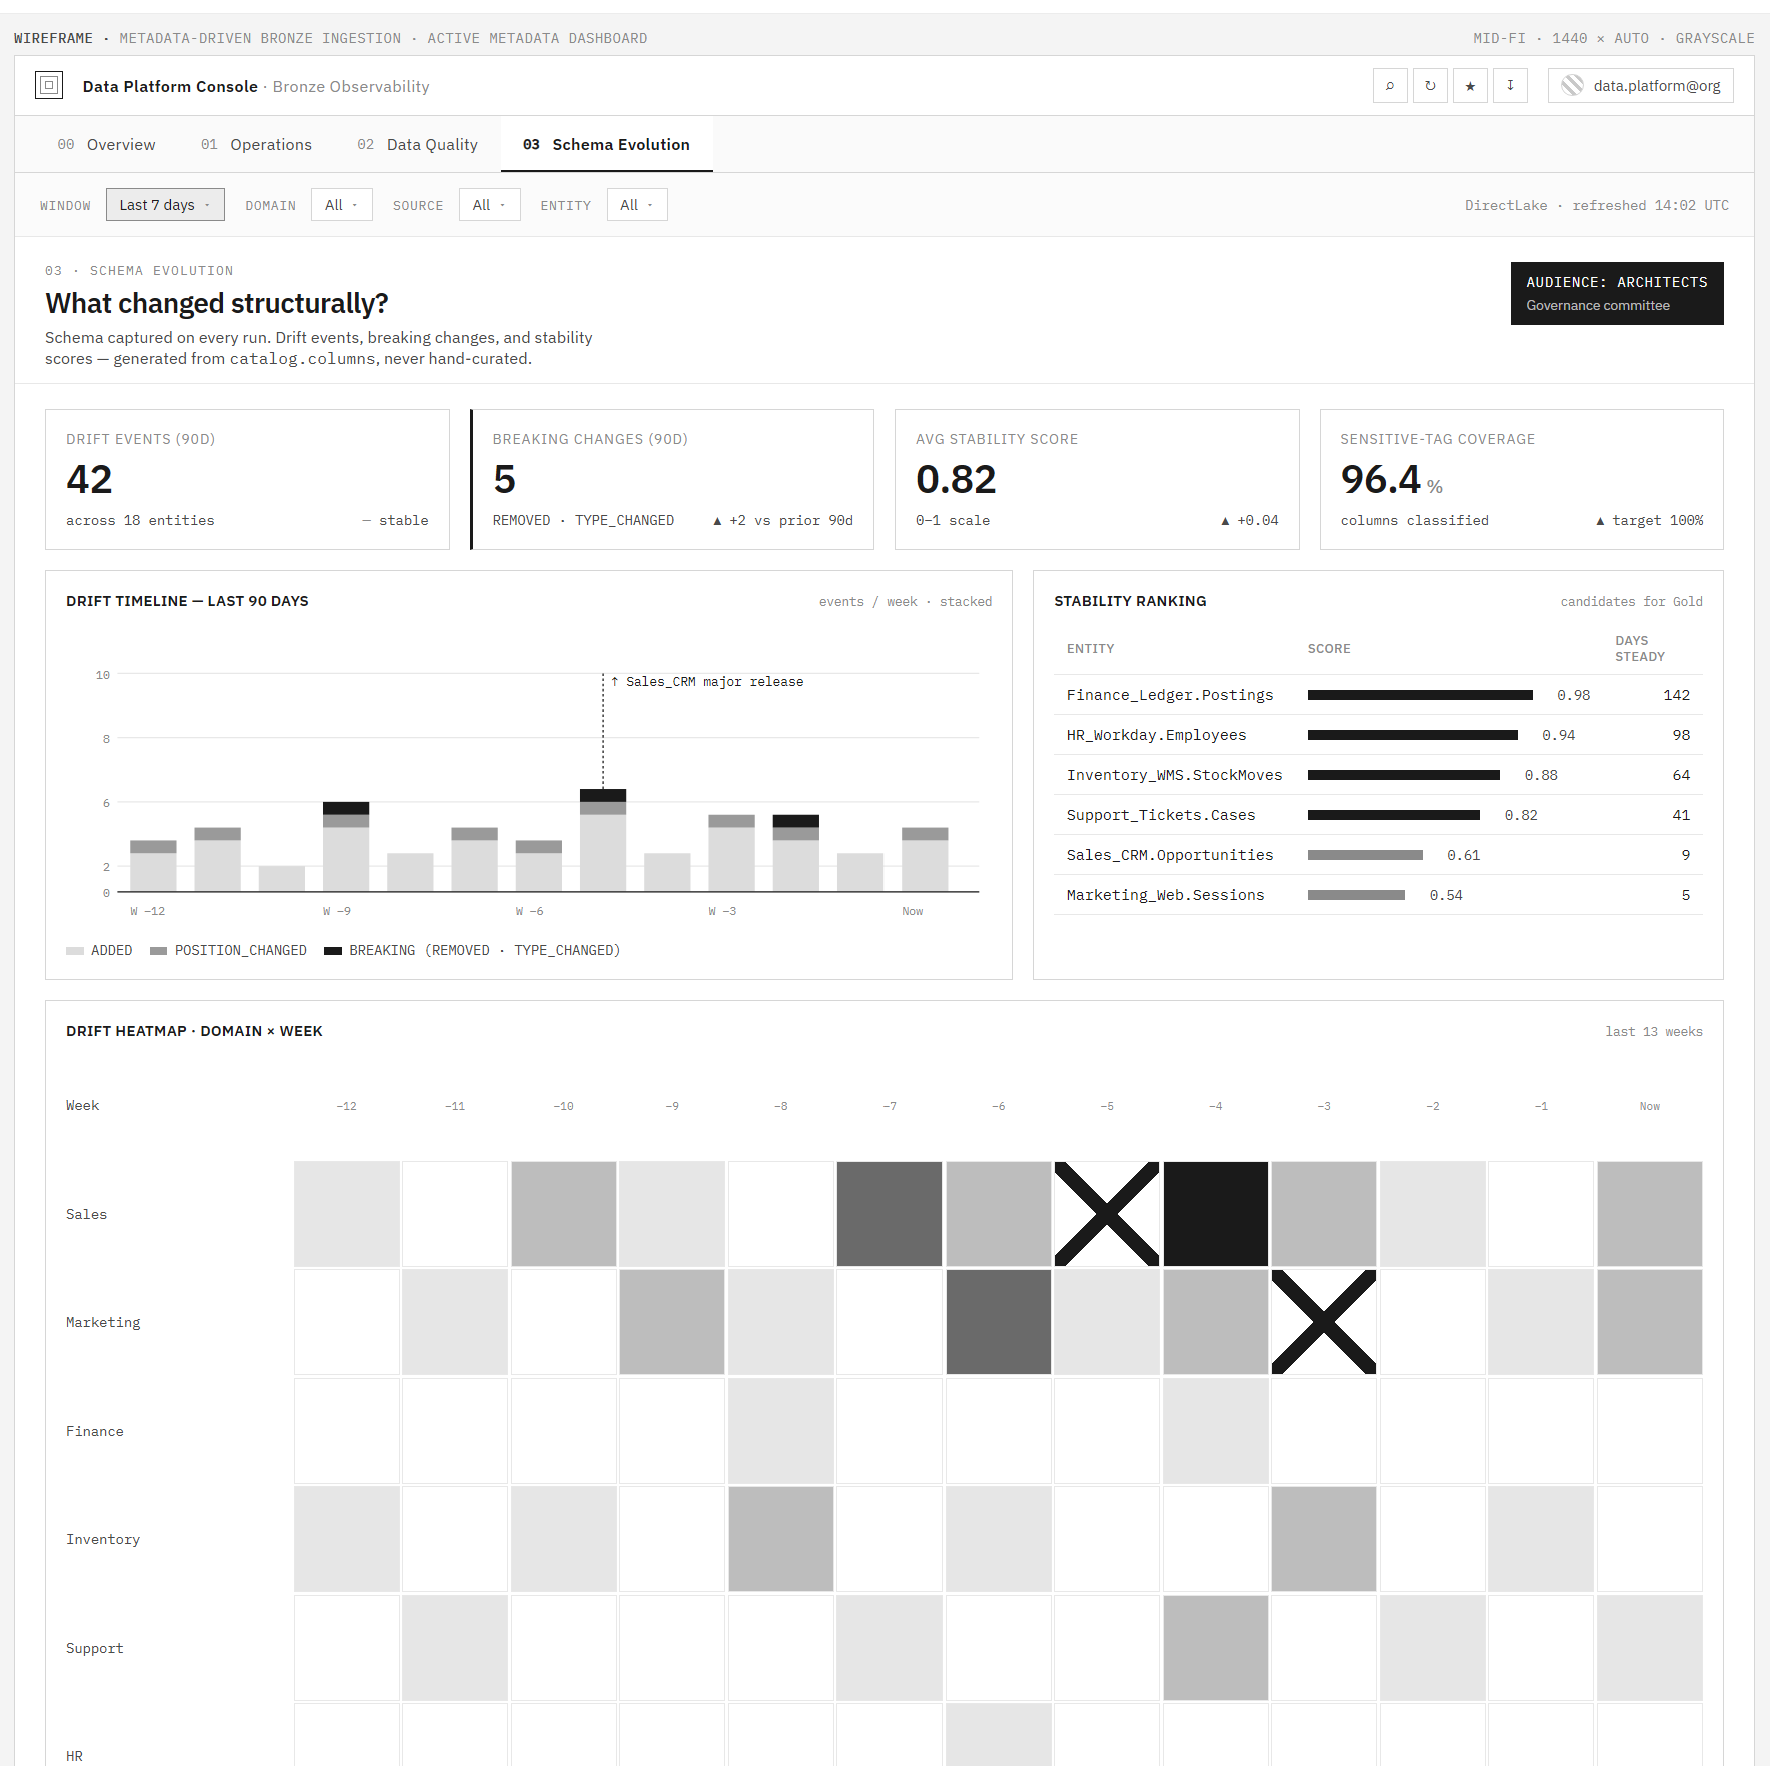 Mockup – Schema Evolution view (in development): drift events over 90 days, breaking changes, stability scores by entity, sensitive-tag coverage, and a domain × week heatmap, once built, sourced from
 catalog.Columns, never hand-curated.
The data is generated automatically. No one has to remember to update catalog.Columns when a schema changes – the next ingestion run does it. No one updates control.VolumeCheckQuarantine manually – it populates when a threshold is breached. Once built, the dashboards above will be views over live state, not over a maintained document.
The feedback loop – now visible
These feedback patterns existed before Post 6. Schema drift triggered YAML updates in Post 4. Volume anomalies drove threshold adjustments. New columns prompted PII tags. The loop was always there. What Post 6 adds is visibility – the loop is now queryable from the same dashboard as the operational data it responds to. Before: you could trace it via git blame if you knew what to look for. Now: you can see it in Power BI alongside the events that triggered it.
The loop patterns – now queryable:
- Schema drift →
catalog.Columnscaptures the new column → DQ steward reviews → YAML updated viaCFG-SCHEMA-01 - Volume anomaly → entity goes to quarantine → YAML
min_rows/max_rowsadjusted viaCFG-THRESHOLD-01 - PII in new column →
catalog.Columnsflags it →security.classification: "PII"added via PR - Config change correlation → Git already records the threshold adjustment;
catalog.YamlChanges(once wired) lets you join it with the quarantine rate that followed in a single SQL query
In most Lakehouses, the feedback loop is a meeting. In this system, it’s a commit – observable, diff-able, traceable to the event that triggered it.
Honest tradeoffs
This system gives you a great deal. It’s worth being explicit about what it doesn’t give you.
Business metadata. What Sales_Opportunities.CloseDate means to a business analyst – its business definition, its calculation rules, how it relates to ARR – still requires human input. No amount of schema capture fills that gap. You have technical metadata and operational metadata. Business metadata remains a documentation project.
Enterprise lineage. You have Bronze lineage: every row traces to its source system, run, and batch. You don’t have what happens to the data after it leaves your Lakehouse. If Opportunities feeds a downstream ERP or a finance report, that lineage lives outside your control tables.
Fully wired alerts. RunbookRef as a first-class dimension in ops analytics – mentioned in Post 5 – is aspirational. The wiring between alert payload and runbook ID isn’t automatic yet. The analytics are there; the plumbing to make alerts self-identifying still requires tooling work.
Two pieces not yet wired. The Warehouse, Stored Procedures, and semantic model are built and live. The dashboards are designed and being built – “the data is ready” is true, “the dashboards are live” is not yet. catalog.YamlChanges is the second piece: the Git audit trail is complete, only the ETL that materializes it as a queryable table is pending. Until both land: dashboards live in mockups, and config-vs-outcome correlations require git log plus a steward’s manual cross-reference.
Config drift is still a manual discipline. catalog.ConfigFiles helps detect it – you can compare the deployed commit hash against Git’s current HEAD. But there is no automated CD. Every deploy requires a human to copy the YAML to the Lakehouse and run a smoke test. CFG-SYNC-01 documents the procedure; the procedure still depends on the engineer remembering to follow it. Detection improved; prevention didn’t.
What you do get: observability without a separate observability stack. Governance coverage without a separate catalog project. Quality monitoring without a separate DQ tool. These emerged as side-effects of designing the ingestion layer well from day one. You didn’t add them – you uncovered them.
The tap, revisited
Here’s the complete system, stated plainly.
A fixed engine of specialized components handles relational and file sources – the same patterns extend to REST APIs – without new code per source. N YAML files declare what to ingest, how to classify it, who owns it, what governance applies. Yamale validates the shape of every YAML before it deploys. The filename encodes domain ownership as a political contract, not just a naming convention. Every change to every YAML goes through Git – reviewed, diff-able, reversible.
The scheduler declares data freshness as a contract. Distributed locks prevent double-execution. Retry policy lives in one place. Every schedule decision is a Git commit.
Battle scars are encoded where they belong – in the YAML, not in tribal knowledge. The engine handles legacy date formats, partial failures, zombie locks, and config sync gaps without human intervention. Where it can’t, a runbook holds the procedure. Versioned. Scoped. 3am-ready.
And all of it – every execution, every schema change, every volume anomaly, every lock acquired and released – was generating metadata the whole time. Six posts to build the engine. This post to wire up what the engine was always producing.
Post 1 opened with a tap. Bronze should be boring. Infrastructure is invisible. You turn on the tap and water comes out – you don’t think about the pipes.
Post 6 closes with what happens when the tap works: you stop thinking about the tap and start thinking about what you do with the water.
The metadata-driven platform doesn’t just ingest data more reliably. It generates the raw material for operations, quality, and governance decisions as a natural side-effect of being well-designed. You didn’t build a catalog. You didn’t stand up an observability platform. You didn’t commission a governance reporting project. You built an ingestion layer that couldn’t help but document itself, monitor itself, and generate the raw material for the reports that will drive decisions about itself. The runbooks, notebooks, and Git PRs were always acting on it. The dashboards are the last mile.
Bronze was boring. That was always the plan. What wasn’t obvious on day one: boring infrastructure generates interesting metadata. The dashboards finish what the engine started.
This is the sixth and final post in the series “YAML Metadata-Driven Ingestion.” The patterns described here have evolved across several enterprise Lakehouse implementations and are platform-agnostic, though our reference stack is Microsoft Fabric.
Enjoy Reading This Article?
Here are some more articles you might like to read next: